SunTrust 2012 Annual Report Download - page 62
Download and view the complete annual report
Please find page 62 of the 2012 SunTrust annual report below. You can navigate through the pages in the report by either clicking on the pages listed below, or by using the keyword search tool below to find specific information within the annual report.-
 1
1 -
2
-
3
-
4
-
5
-
6
-
7
-
8
-
9
-
10
-
11
-
12
-
13
-
14
-
15
-
16
-
17
-
18
-
19
-
20
-
21
-
22
-
23
-
24
-
25
-
26
-
27
-
28
-
29
-
30
-
31
-
32
-
33
-
34
-
35
-
36
-
37
-
38
-
39
-
40
-
41
-
42
-
43
-
44
-
45
-
46
-
47
-
48
-
49
-
50
-
51
-
 52
52 -
 53
53 -
 54
54 -
 55
55 -
 56
56 -
 57
57 -
 58
58 -
 59
59 -
 60
60 -
 61
61 -
 62
62 -
 63
63 -
 64
64 -
 65
65 -
 66
66 -
 67
67 -
 68
68 -
 69
69 -
 70
70 -
 71
71 -
 72
72 -
73
-
74
-
75
-
76
-
77
-
78
-
79
-
80
-
81
-
82
-
83
-
84
-
85
-
86
-
87
-
88
-
89
-
90
-
91
-
92
-
93
-
94
-
95
-
96
-
97
-
98
-
99
-
100
-
101
-
102
-
103
-
104
-
105
-
106
-
107
-
108
-
109
-
110
-
111
-
112
-
113
-
114
-
115
-
116
-
117
-
118
-
119
-
120
-
121
-
122
-
123
-
124
-
125
-
126
-
127
-
128
-
129
-
130
-
131
-
132
-
133
-
134
-
135
-
136
-
137
-
138
-
139
-
140
-
141
-
142
-
143
-
144
-
145
-
146
-
147
-
148
-
149
-
150
-
151
-
152
-
153
-
154
-
155
-
156
-
157
-
158
-
159
-
160
-
161
-
162
-
163
-
164
-
165
-
166
-
167
-
168
-
169
-
170
-
171
-
172
-
173
-
174
-
175
-
176
-
177
-
178
-
179
-
180
-
181
-
182
-
183
-
184
-
185
-
186
-
187
-
188
-
189
-
190
-
191
-
192
-
193
-
194
-
195
-
196
-
197
-
198
-
199
-
200
-
201
-
202
-
203
-
204
-
205
-
206
-
207
-
208
-
209
-
210
-
211
-
212
-
213
-
214
-
215
-
216
-
217
-
218
-
219
-
220
-
221
-
222
-
223
-
224
-
225
-
226
-
227
-
228
 |
 |

46
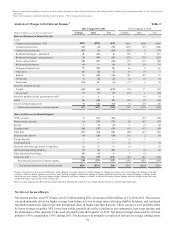
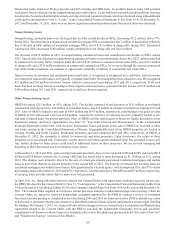
We believe that our investor-owned portfolio is appropriately diversified by borrower, geography, and property type. We
typically underwrite commercial projects to credit standards that are more stringent than historical commercial MBS guidelines.
Where appropriate, we have taken prudent actions with our clients to strengthen our credit position. These actions reflect
market terms and structures and are intended to improve the client’s financial ability to perform. Impaired loans are assessed
relative to the client’s and guarantor’s, if any, ability to service the debt, the loan terms, and the value of the property. These
factors are taken into consideration when formulating our ALLL through our credit risk rating and/or specific reserving
processes.
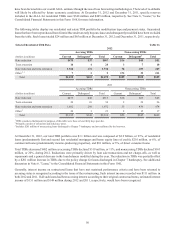
Residential loans declined during 2012. We experienced declines across all residential loan classes except nonguaranteed
residential mortgages, which increased $146 million, or 1%, during 2012, despite the sale of $486 million, net of $193 million
in charge-offs, of nonperforming mortgages. The overall increase in our nonguaranteed residential mortgage portfolio was a
result of the low interest rate environment generating new loan demand and greater origination volume, net of payoffs,
offsetting much of the declines in the remaining residential classes. Nonguaranteed residential mortgage loan growth came
predominantly from borrowers with high FICO scores (i.e., 760 or above) and lower LTV ratios. Conversely, government-
guaranteed residential mortgages decreased $2.4 billion, or 36%, during 2012, due to the sale of approximately $1.1 billion
of guaranteed residential mortgages, net of write-downs, and higher levels of refinancing and loan paydowns. Our election
to sell a portion of this guaranteed portfolio was part of our continued active management of the balance sheet, as recent
quarters have yielded organic growth and the higher-risk loan balances have declined.
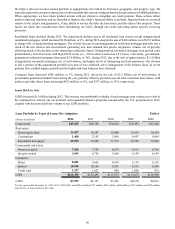
Consumer loans decreased $580 million, or 3%, during 2012, driven by the sale of $2.2 billion, net of write-downs, in
government-guaranteed student loans during the year, partially offset by growth across all other consumer loan classes, with
indirect and other direct loans increasing $833 million, or 8%, and $337 million, or 16%, respectively.
Loans Held for Sale
LHFS increased $1.0 billion during 2012. The increase was attributable to higher closed mortgage loan volume as a result of
the continued low interest rate environment and expanded refinance programs announced by the U.S. government in 2012,
coupled with decreased delivery volume to our LHFI portfolio.
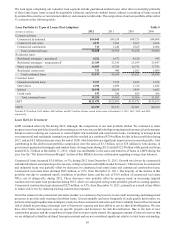
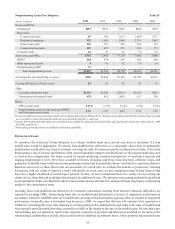
Loan Portfolio by Types of Loans (Pre-Adoption) Table 6
(Dollars in millions) 2012 2011 2010 2009 2008
Commercial $45,265 $40,104 $34,064 $32,494 $41,040
Real estate:
Home equity lines 13,437 14,287 15,040 15,953 16,454
Construction 1,468 2,143 3,848 6,647 9,864
Residential mortgages129,909 32,608 31,572 30,790 32,066
Commercial real estate:
Owner occupied 7,306 7,753 8,674 8,915 8,758
Investor owned 3,919 4,758 5,868 6,159 6,199
Consumer:
Direct 8,041 9,655 6,638 5,118 5,139
Indirect 10,998 10,164 9,291 6,531 6,508
Credit card 1,127 1,023 980 1,068 970
LHFI $121,470 $122,495 $115,975 $113,675 $126,998
LHFS $3,399 $2,353 $3,501 $4,670 $4,032
1For the years ended December 31, 2012, 2011, 2010, 2009, and 2008, includes $379 million, $431 million, $488 million, $437 million, and $239 million,
respectively, of loans carried at fair value.