SunTrust 2012 Annual Report Download - page 56
Download and view the complete annual report
Please find page 56 of the 2012 SunTrust annual report below. You can navigate through the pages in the report by either clicking on the pages listed below, or by using the keyword search tool below to find specific information within the annual report.-
 1
1 -
2
-
3
-
4
-
5
-
6
-
7
-
8
-
9
-
10
-
11
-
12
-
13
-
14
-
15
-
16
-
17
-
18
-
19
-
20
-
21
-
22
-
23
-
24
-
25
-
26
-
27
-
28
-
29
-
30
-
31
-
32
-
33
-
34
-
35
-
36
-
37
-
38
-
39
-
40
-
41
-
42
-
43
-
44
-
45
-
 46
46 -
 47
47 -
 48
48 -
 49
49 -
 50
50 -
 51
51 -
 52
52 -
 53
53 -
 54
54 -
 55
55 -
 56
56 -
 57
57 -
 58
58 -
 59
59 -
 60
60 -
 61
61 -
 62
62 -
 63
63 -
 64
64 -
 65
65 -
 66
66 -
67
-
68
-
69
-
70
-
71
-
72
-
73
-
74
-
75
-
76
-
77
-
78
-
79
-
80
-
81
-
82
-
83
-
84
-
85
-
86
-
87
-
88
-
89
-
90
-
91
-
92
-
93
-
94
-
95
-
96
-
97
-
98
-
99
-
100
-
101
-
102
-
103
-
104
-
105
-
106
-
107
-
108
-
109
-
110
-
111
-
112
-
113
-
114
-
115
-
116
-
117
-
118
-
119
-
120
-
121
-
122
-
123
-
124
-
125
-
126
-
127
-
128
-
129
-
130
-
131
-
132
-
133
-
134
-
135
-
136
-
137
-
138
-
139
-
140
-
141
-
142
-
143
-
144
-
145
-
146
-
147
-
148
-
149
-
150
-
151
-
152
-
153
-
154
-
155
-
156
-
157
-
158
-
159
-
160
-
161
-
162
-
163
-
164
-
165
-
166
-
167
-
168
-
169
-
170
-
171
-
172
-
173
-
174
-
175
-
176
-
177
-
178
-
179
-
180
-
181
-
182
-
183
-
184
-
185
-
186
-
187
-
188
-
189
-
190
-
191
-
192
-
193
-
194
-
195
-
196
-
197
-
198
-
199
-
200
-
201
-
202
-
203
-
204
-
205
-
206
-
207
-
208
-
209
-
210
-
211
-
212
-
213
-
214
-
215
-
216
-
217
-
218
-
219
-
220
-
221
-
222
-
223
-
224
-
225
-
226
-
227
-
228
 |
 |

40
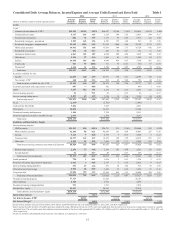
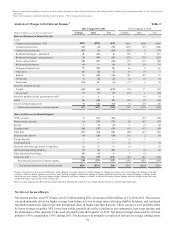
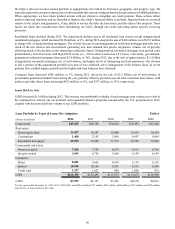
the decline in long-term debt was primarily attributable to the redemption of $1.2 billion of higher cost trust preferred securities
during the third quarter of 2012, which had a weighted average rate of approximately 7%. The interest rate environment
allowed for ongoing active management of interest-bearing liabilities during 2012, the result of which was a decrease of 29
basis points on rates paid on interest-bearing liabilities during the year. This decrease was primarily due to an 80 basis point
decline in rates paid on long-term debt, as well as a 17 basis point decline in rates paid on consumer and commercial deposits,
as we improved our funding mix by replacing higher-cost time deposits and long-term debt with lower cost deposits and
wholesale funding.
During 2012, the interest rate environment was characterized by a flatter yield curve versus 2011, as rates at the long end of
the curve declined. More specifically, during 2012, benchmark rates were as follows compared to 2011; one-month LIBOR
averaged 0.24%, an increase of 1 basis point, three-month LIBOR averaged 0.43%, an increase of 9 basis points, five-year
swaps averaged 0.98%, a decrease of 81 basis points, and ten-year swaps averaged 1.88%, a decrease of 102 basis points.
During 2012, the Fed funds target rate averaged 0.25% and the Prime rate averaged 3.25%, both unchanged from 2011.
Foregone Interest
Foregone interest income from NPLs reduced net interest margin by 8 basis points during 2012, compared with a reduction
of 15 basis points during 2011, as average nonaccrual loans decreased by $1.2 billion during the year ended December 31,
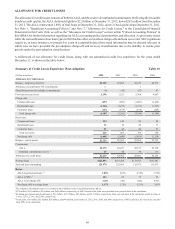
2012. See additional discussion of our expectations for future levels of credit quality in the “Allowance for Credit Losses”
and “Nonperforming Assets” sections of this MD&A. Tables 1 and 2 contain more detailed information concerning average
balances, yields earned, and rates paid.
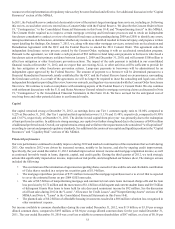
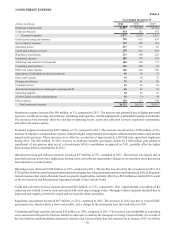
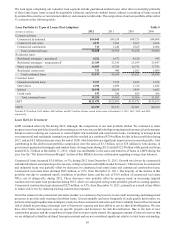
NONINTEREST INCOME Table 3
Year Ended December 31
(Dollars in millions) 2012 2011 2010
Service charges on deposit accounts $676 $685 $760
Other charges and fees 478 507 534
Card fees 240 371 376
Trust and investment management income 512 531 503
Retail investment services 241 230 205
Investment banking income 342 317 313
Trading income 211 248 173
Mortgage production related income/(loss) 343 (5) 127
Mortgage servicing related income 260 224 358
Net securities gains 1,974 117 191
Other noninterest income 96 196 189
Total noninterest income $5,373 $3,421 $3,729
Noninterest income increased by $2.0 billion, or 57%, compared to the year ended December 31, 2011, driven primarily by
$1.9 billion in securities gains, due to the sale of our Coke common stock, increased mortgage-related and investment banking
income, partially offset by lower card fees and other income, which was due to losses from loan sales primarily during the
second half of 2012.
Net securities gains increased by $1.9 billion for 2012 compared to the prior year due to pre-tax gains resulting from the sale
of our Coke common stock, net of losses due to the accelerated termination of the Agreements. See "Investment in Common
Shares of the Coca-Cola Company" in this MD&A for additional information. For further discussion regarding our investment
portfolio activity, see “Securities Available for Sale” in this MD&A.
Mortgage production related income for 2012 was $343 million, up $348 million, from the prior year due to an increase in
mortgage production and gain on sale margins, partially offset by a higher mortgage repurchase provision. Loan production
volume increased $9.0 billion, or 39%, from prior year to $32.1 billion resulting in higher fee income and gains on sale.
Mortgage production during 2012 was comprised of approximately 70% in refinance activity and increased in part due to the
HARP 2.0 program. The HARP 2.0 program contributed approximately 20% to the total production activity for 2012. Over
the course of 2013 we expect gain on sale margins to compress and refinance activity to abate. While we believe that many
clients can still benefit from refinancing, the home purchase market is showing improvement and we are continuing to devote
resources to home purchase activity to position us for the longer term.