SunTrust 2012 Annual Report Download - page 78
Download and view the complete annual report
Please find page 78 of the 2012 SunTrust annual report below. You can navigate through the pages in the report by either clicking on the pages listed below, or by using the keyword search tool below to find specific information within the annual report.-
 1
1 -
2
-
3
-
4
-
5
-
6
-
7
-
8
-
9
-
10
-
11
-
12
-
13
-
14
-
15
-
16
-
17
-
18
-
19
-
20
-
21
-
22
-
23
-
24
-
25
-
26
-
27
-
28
-
29
-
30
-
31
-
32
-
33
-
34
-
35
-
36
-
37
-
38
-
39
-
40
-
41
-
42
-
43
-
44
-
45
-
46
-
47
-
48
-
49
-
50
-
51
-
52
-
53
-
54
-
55
-
56
-
57
-
58
-
59
-
60
-
61
-
62
-
63
-
64
-
65
-
66
-
67
-
 68
68 -
 69
69 -
 70
70 -
 71
71 -
 72
72 -
 73
73 -
 74
74 -
 75
75 -
 76
76 -
 77
77 -
 78
78 -
 79
79 -
 80
80 -
 81
81 -
 82
82 -
 83
83 -
 84
84 -
 85
85 -
 86
86 -
 87
87 -
 88
88 -
89
-
90
-
91
-
92
-
93
-
94
-
95
-
96
-
97
-
98
-
99
-
100
-
101
-
102
-
103
-
104
-
105
-
106
-
107
-
108
-
109
-
110
-
111
-
112
-
113
-
114
-
115
-
116
-
117
-
118
-
119
-
120
-
121
-
122
-
123
-
124
-
125
-
126
-
127
-
128
-
129
-
130
-
131
-
132
-
133
-
134
-
135
-
136
-
137
-
138
-
139
-
140
-
141
-
142
-
143
-
144
-
145
-
146
-
147
-
148
-
149
-
150
-
151
-
152
-
153
-
154
-
155
-
156
-
157
-
158
-
159
-
160
-
161
-
162
-
163
-
164
-
165
-
166
-
167
-
168
-
169
-
170
-
171
-
172
-
173
-
174
-
175
-
176
-
177
-
178
-
179
-
180
-
181
-
182
-
183
-
184
-
185
-
186
-
187
-
188
-
189
-
190
-
191
-
192
-
193
-
194
-
195
-
196
-
197
-
198
-
199
-
200
-
201
-
202
-
203
-
204
-
205
-
206
-
207
-
208
-
209
-
210
-
211
-
212
-
213
-
214
-
215
-
216
-
217
-
218
-
219
-
220
-
221
-
222
-
223
-
224
-
225
-
226
-
227
-
228
 |
 |

62
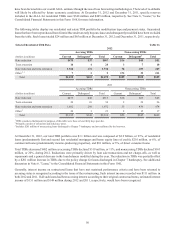
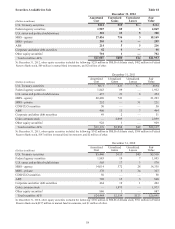
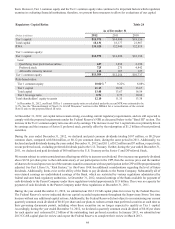
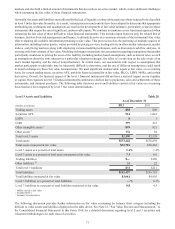
BORROWINGS
Short-Term Borrowings Table 22
As of December 31, 2012 Year Ended December 31, 2012
Balance Rate
Daily Average Maximum
Outstanding at
any Month-End
(Dollars in millions) Balance Rate
Funds purchased1$617 0.09% $798 0.11% $925
Securities sold under agreements to repurchase11,574 0.18 1,602 0.18 1,781
FHLB advances 1,500 0.34 5,149 0.24 9,000
Other short-term borrowings21,803 0.29 1,803 0.33 2,057
As of December 31, 2011 Year Ended December 31, 2011
Balance Rate
Daily Average Maximum
Outstanding at
any Month-End
(Dollars in millions) Balance Rate
Funds purchased 1$839 0.09% $1,038 0.13% $1,169
Securities sold under agreements to repurchase 11,644 0.13 2,157 0.15 2,411
FHLB advances 7,000 0.14 604 0.21 7,000
Other short-term borrowings 21,983 0.50 2,861 0.39 3,218
As of December 31, 2010 Year Ended December 31, 2010
Balance Rate
Daily Average Maximum
Outstanding at
any Month-End
(Dollars in millions) Balance Rate
Funds purchased 1$951 0.18% $1,226 0.19% $3,163
Securities sold under agreements to repurchase 12,180 0.17 2,416 0.15 2,830
Other short-term borrowings 22,690 0.70 3,014 0.43 4,894
1 Funds purchased and securities sold under agreements to repurchase mature overnight or at a fixed maturity generally not exceeding three months. Rates
on overnight funds reflect current market rates. Rates on fixed maturity borrowings are set at the time of borrowings.
2 Other short-term borrowings includes master notes, dealer collateral, U.S. Treasury demand notes, CP, and other short-term borrowed funds.
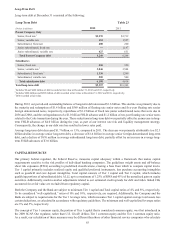
Short-Term Borrowings
As of December 31, 2012, our period-end short-term borrowings decreased $6.0 billion, or 52%, from December 31, 2011,
predominantly due to a $5.5 billion decrease in short-term FHLB advances as a result of our decision to utilize loan sale
proceeds during the year to reduce short-term borrowings. We also experienced decreases of $222 million in funds purchased,
$198 million in master notes, and $70 million in securities sold under agreements to repurchase, slightly offset by a $17
million increase in dealer collateral.
For the year ended December 31, 2012, our daily average short-term borrowings increased $2.7 billion, or 40%, compared
to the year ended December 31, 2011. The increase was primarily attributable to increased daily average FHLB advances of
$4.5 billion, partially offset by decreases in daily average balances for dealer collateral of $570 million, securities sold under
agreements to repurchase of $555 million, and funds purchased of $240 million.
For the year ended December 31, 2012, our maximum monthly outstanding balance of FHLB advances was materially higher
than the period-end and daily average balances as a result of increased holdings of FHLB borrowings towards the beginning
of 2012, due to ordinary balance sheet management practices. Our maximum monthly outstanding balances for funds
purchased, securities sold under agreements to repurchase, and other short-term borrowings were not materially different
from period-end balances or from the daily average balances for 2012.