SunTrust 2012 Annual Report Download - page 75
Download and view the complete annual report
Please find page 75 of the 2012 SunTrust annual report below. You can navigate through the pages in the report by either clicking on the pages listed below, or by using the keyword search tool below to find specific information within the annual report.-
 1
1 -
2
-
3
-
4
-
5
-
6
-
7
-
8
-
9
-
10
-
11
-
12
-
13
-
14
-
15
-
16
-
17
-
18
-
19
-
20
-
21
-
22
-
23
-
24
-
25
-
26
-
27
-
28
-
29
-
30
-
31
-
32
-
33
-
34
-
35
-
36
-
37
-
38
-
39
-
40
-
41
-
42
-
43
-
44
-
45
-
46
-
47
-
48
-
49
-
50
-
51
-
52
-
53
-
54
-
55
-
56
-
57
-
58
-
59
-
60
-
61
-
62
-
63
-
64
-
 65
65 -
 66
66 -
 67
67 -
 68
68 -
 69
69 -
 70
70 -
 71
71 -
 72
72 -
 73
73 -
 74
74 -
 75
75 -
 76
76 -
 77
77 -
 78
78 -
 79
79 -
 80
80 -
 81
81 -
 82
82 -
 83
83 -
 84
84 -
 85
85 -
86
-
87
-
88
-
89
-
90
-
91
-
92
-
93
-
94
-
95
-
96
-
97
-
98
-
99
-
100
-
101
-
102
-
103
-
104
-
105
-
106
-
107
-
108
-
109
-
110
-
111
-
112
-
113
-
114
-
115
-
116
-
117
-
118
-
119
-
120
-
121
-
122
-
123
-
124
-
125
-
126
-
127
-
128
-
129
-
130
-
131
-
132
-
133
-
134
-
135
-
136
-
137
-
138
-
139
-
140
-
141
-
142
-
143
-
144
-
145
-
146
-
147
-
148
-
149
-
150
-
151
-
152
-
153
-
154
-
155
-
156
-
157
-
158
-
159
-
160
-
161
-
162
-
163
-
164
-
165
-
166
-
167
-
168
-
169
-
170
-
171
-
172
-
173
-
174
-
175
-
176
-
177
-
178
-
179
-
180
-
181
-
182
-
183
-
184
-
185
-
186
-
187
-
188
-
189
-
190
-
191
-
192
-
193
-
194
-
195
-
196
-
197
-
198
-
199
-
200
-
201
-
202
-
203
-
204
-
205
-
206
-
207
-
208
-
209
-
210
-
211
-
212
-
213
-
214
-
215
-
216
-
217
-
218
-
219
-
220
-
221
-
222
-
223
-
224
-
225
-
226
-
227
-
228
 |
 |

59
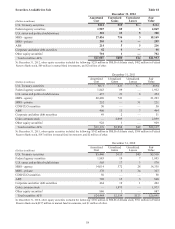
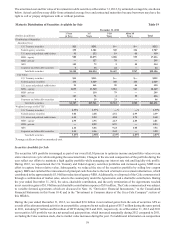
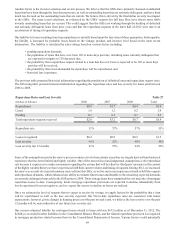
The amortized cost and fair value of investments in debt securities at December 31, 2012, by estimated average life, are shown
below. Actual cash flows may differ from estimated average lives and contractual maturities because borrowers may have the
right to call or prepay obligations with or without penalties.
Maturity Distribution of Securities Available for Sale Table 19
December 31, 2012
(Dollars in millions) 1 Year
or Less 1-5
Years 5-10
Years After 10
Years Total
Distribution of Maturities:
Amortized Cost:
U.S. Treasury securities $11 $201 $— $— $212
Federal agency securities 130 1,381 340 136 1,987
U.S. states and political subdivisions 91 152 19 48 310
MBS - agency 980 12,875 3,006 555 17,416
MBS - private — 127 78 — 205
ABS 112 72 2 28 214
Corporate and other debt securities 4 16 22 — 42
Total debt securities $1,328 $14,824 $3,467 $767 $20,386
Fair Value:
U.S. Treasury securities $11 $211 $— $— $222
Federal agency securities 131 1,449 348 141 2,069
U.S. states and political subdivisions 93 161 20 46 320
MBS - agency 1,035 13,520 3,051 563 18,169
MBS - private — 130 79 — 209
ABS 113 71 2 30 216
Corporate and other debt securities 4 19 23 — 46
Total debt securities $1,387 $15,561 $3,523 $780 $21,251
Weighted average yield (FTE)1:
U.S. Treasury securities 2.35% 1.97% —% —% 1.99%
Federal agency securities 3.66 2.18 2.51 2.99 2.39
U.S. states and political subdivisions 6.41 5.94 4.94 3.75 5.68
MBS - agency 2.90 2.96 2.13 2.80 2.81
MBS - private — 8.89 8.75 — 8.83
ABS 2.16 6.46 9.24 1.08 3.52
Corporate and other debt securities 1.42 5.36 2.43 — 3.20
Total debt securities 3.15% 2.98% 2.33% 2.83% 2.87%
1Average yields are based on amortized cost.
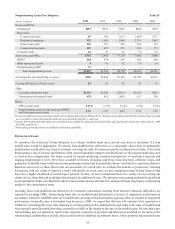
Securities Available for Sale
The securities AFS portfolio is managed as part of our overall ALM process to optimize income and portfolio value over an
entire interest rate cycle while mitigating the associated risks. Changes in the size and composition of the portfolio during the
year reflect our efforts to maintain a high quality portfolio while managing our interest rate risk and liquidity risk profile.
During 2012, we repositioned the U.S. Treasury and Federal agency securities portfolios and increased agency MBS in an
effort to capture better relative value. Subsequently, we reduced the size of the securities portfolio by selling low coupon
agency MBS and curtailed the reinvestment of principal cash flow due to the lack of attractive investment alternatives, which
contributed to the approximately $3.0 billion reduction of agency MBS. Additionally, we disposed of the Coke common stock
through a combination of market sales, sales to the counterparty under the Agreements, and a charitable contribution. During
the year ended December 31, 2012, the sales, charitable contribution, and the early termination of the Agreements resulted
in net securities gains of $1.9 billion and charitable contribution expense of $38 million. The Coke common stock was subject
to variable forward agreements which are discussed in Note 16, “Derivative Financial Instruments,” to the Consolidated
Financial Statements in this Form 10-K and in the "Investment in Common shares of the Coca-Cola Company" section of
this MD&A.
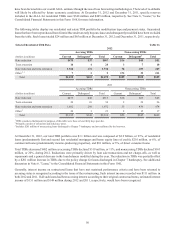
During the year ended December 31, 2012, we recorded $2.0 billion in net realized gains from the sale of securities AFS as
a result of the aforementioned activities in our portfolio, compared to net realized gains of $117 million during the same period
in 2011, including $7 million and $6 million of OTTI during 2012 and 2011, respectively. As of December 31, 2012 and 2011
our securities AFS portfolio was in a net unrealized gain position, which increased marginally during 2012 compared to 2011,
excluding the Coke common stock, due to market value increases during the year. For additional information on composition