SunTrust 2012 Annual Report Download - page 107
Download and view the complete annual report
Please find page 107 of the 2012 SunTrust annual report below. You can navigate through the pages in the report by either clicking on the pages listed below, or by using the keyword search tool below to find specific information within the annual report.-
 1
1 -
2
-
3
-
4
-
5
-
6
-
7
-
8
-
9
-
10
-
11
-
12
-
13
-
14
-
15
-
16
-
17
-
18
-
19
-
20
-
21
-
22
-
23
-
24
-
25
-
26
-
27
-
28
-
29
-
30
-
31
-
32
-
33
-
34
-
35
-
36
-
37
-
38
-
39
-
40
-
41
-
42
-
43
-
44
-
45
-
46
-
47
-
48
-
49
-
50
-
51
-
52
-
53
-
54
-
55
-
56
-
57
-
58
-
59
-
60
-
61
-
62
-
63
-
64
-
65
-
66
-
67
-
68
-
69
-
70
-
71
-
72
-
73
-
74
-
75
-
76
-
77
-
78
-
79
-
80
-
81
-
82
-
83
-
84
-
85
-
86
-
87
-
88
-
89
-
90
-
91
-
92
-
93
-
94
-
95
-
96
-
 97
97 -
 98
98 -
 99
99 -
 100
100 -
 101
101 -
 102
102 -
 103
103 -
 104
104 -
 105
105 -
 106
106 -
 107
107 -
 108
108 -
 109
109 -
 110
110 -
 111
111 -
 112
112 -
 113
113 -
 114
114 -
 115
115 -
 116
116 -
 117
117 -
118
-
119
-
120
-
121
-
122
-
123
-
124
-
125
-
126
-
127
-
128
-
129
-
130
-
131
-
132
-
133
-
134
-
135
-
136
-
137
-
138
-
139
-
140
-
141
-
142
-
143
-
144
-
145
-
146
-
147
-
148
-
149
-
150
-
151
-
152
-
153
-
154
-
155
-
156
-
157
-
158
-
159
-
160
-
161
-
162
-
163
-
164
-
165
-
166
-
167
-
168
-
169
-
170
-
171
-
172
-
173
-
174
-
175
-
176
-
177
-
178
-
179
-
180
-
181
-
182
-
183
-
184
-
185
-
186
-
187
-
188
-
189
-
190
-
191
-
192
-
193
-
194
-
195
-
196
-
197
-
198
-
199
-
200
-
201
-
202
-
203
-
204
-
205
-
206
-
207
-
208
-
209
-
210
-
211
-
212
-
213
-
214
-
215
-
216
-
217
-
218
-
219
-
220
-
221
-
222
-
223
-
224
-
225
-
226
-
227
-
228
 |
 |
91
Year Ended December 31, 2011 vs. 2010
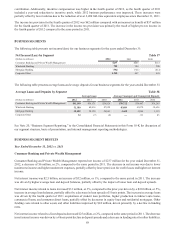
Consumer Banking and Private Wealth Management
Consumer Banking and Private Wealth Management reported net income of $243 million for the year ended December 31,
2011, an increase of $128 million compared to the same period in 2010. The increase in net income was attributable to a
decrease in provision for credit losses combined with an increase in net interest income, and a decrease in noninterest expense,
partially offset by a decrease in noninterest income.
Net interest income was $2.5 billion, an increase of $53 million, or 2%, compared to the same period in 2010. The increase
was driven by higher average loan and deposit balances and higher loan spreads, partially offset by the impact of lower deposit
spreads.
Net interest income related to loans increased $69 million, or 7%, compared to prior year driven by a $2.2 billion, or 6%,
increase in average loan balances and a 3 basis point increase in loan spreads. The increase in average loans was driven by
organic indirect auto loan production, by the acquisition of $1.7 billion of consumer auto loans in the third and fourth quarters
of 2010, and the purchase of $1.6 billion of guaranteed student loans during 2011. Partially offsetting the increases were
decreases in home equity lines and residential mortgages.
Net interest income related to client deposits was $1.7 billion, a decrease of $30 million, or 2% compared to the same period
in 2010. The decrease in net interest income was driven by a 10 basis point decline in deposit spreads and a decrease in funding
rates for other liabilities. This was partially offset by a $2.1 billion, or 3%, increase in average client deposit balances and
continued favorable deposit mix trends as low cost average deposits increased $5.4 billion, or 10%, and higher cost average
time deposits declined by $3.3 billion, or 16%.
Provision for credit losses was $722 million, a decrease of $169 million, or 19%, compared to the same period in 2010. The
decrease was driven by declines in net charge-offs of: $95 million in equity lines, $34 million in residential mortgage loans,
and $32 million in credit card.
Total noninterest income was $1.5 billion, a decrease of $32 million, or 2%, compared to the same period in 2010. Service
charges on deposits decreased $71 million, or 16%, driven by lower NSF/overdraft fees resulting from Regulation E changes
that became effective in 2010. Other income decreased predominantly due to a gain from the sale of the RidgeWorth Money
Market Fund business in 2010. These decreases were partially offset by increased trust and investment management income
due to higher revenue from the RidgeWorth mutual fund complex, market valuations on managed equity assets, and retail
investment income, which was driven by increased recurring brokerage revenue and annuity income.
Total noninterest expense was $2.9 billion, a decrease of $14 million, or 0.5%, compared to the same period in 2010. The
decrease was predominantly driven by lower corporate overhead allocations and outside processing expense, partially offset
by an increase in employee compensation and operations costs associated with revenue growth.
Wholesale Banking
Wholesale Banking reported net income of $384 million for the year ended December 31, 2011, an increase of $104 million,
or 37%, compared to the same period in 2010. The increase in net income was attributable to decreases in provision for credit
losses and an increase in net interest income, partially offset by increased noninterest expense and decreased noninterest
income.
Net interest income was $1.7 billion, a $166 million, or 10%, increase from the prior year, driven by higher loan and deposit
balances. Net interest income related to loans increased $103 million, or 11%, driven by higher spreads and to a lesser extent
increases in commercial and tax-exempt loans, partially offset by decreases in commercial real estate and other customer
loans. Net interest income related to deposits increased $37 million, or 5%, resulting from a $3.4 billion, or 9%, increase in
client deposit balances. Favorable trends in deposit mix continued as lower-cost demand deposits increased $3.9 billion, or
24%, while average combined interest-bearing transaction accounts and money market accounts also increased $182 million,
or 0.9%, reflecting a shift in customer preference towards demand deposit products. The increases were partially offset by
decreased balances in time deposits from prior year by $647 million, or 22%.
Provision for credit losses was $625 million, a decrease of $152 million, or 20%, from the prior year. The decrease was driven
by lower net charge-offs in commercial loans, commercial real estate loans, leasing, and residential mortgages.
Total noninterest income was $1.4 billion, a decrease of $40 million, or 3%, from the prior year, predominantly driven by
decreased trading revenue, letters of credit fees, card services revenue due to lower rates driven by regulations that became