SunTrust 2012 Annual Report Download - page 72
Download and view the complete annual report
Please find page 72 of the 2012 SunTrust annual report below. You can navigate through the pages in the report by either clicking on the pages listed below, or by using the keyword search tool below to find specific information within the annual report.-
 1
1 -
2
-
3
-
4
-
5
-
6
-
7
-
8
-
9
-
10
-
11
-
12
-
13
-
14
-
15
-
16
-
17
-
18
-
19
-
20
-
21
-
22
-
23
-
24
-
25
-
26
-
27
-
28
-
29
-
30
-
31
-
32
-
33
-
34
-
35
-
36
-
37
-
38
-
39
-
40
-
41
-
42
-
43
-
44
-
45
-
46
-
47
-
48
-
49
-
50
-
51
-
52
-
53
-
54
-
55
-
56
-
57
-
58
-
59
-
60
-
61
-
 62
62 -
 63
63 -
 64
64 -
 65
65 -
 66
66 -
 67
67 -
 68
68 -
 69
69 -
 70
70 -
 71
71 -
 72
72 -
 73
73 -
 74
74 -
 75
75 -
 76
76 -
 77
77 -
 78
78 -
 79
79 -
 80
80 -
 81
81 -
 82
82 -
83
-
84
-
85
-
86
-
87
-
88
-
89
-
90
-
91
-
92
-
93
-
94
-
95
-
96
-
97
-
98
-
99
-
100
-
101
-
102
-
103
-
104
-
105
-
106
-
107
-
108
-
109
-
110
-
111
-
112
-
113
-
114
-
115
-
116
-
117
-
118
-
119
-
120
-
121
-
122
-
123
-
124
-
125
-
126
-
127
-
128
-
129
-
130
-
131
-
132
-
133
-
134
-
135
-
136
-
137
-
138
-
139
-
140
-
141
-
142
-
143
-
144
-
145
-
146
-
147
-
148
-
149
-
150
-
151
-
152
-
153
-
154
-
155
-
156
-
157
-
158
-
159
-
160
-
161
-
162
-
163
-
164
-
165
-
166
-
167
-
168
-
169
-
170
-
171
-
172
-
173
-
174
-
175
-
176
-
177
-
178
-
179
-
180
-
181
-
182
-
183
-
184
-
185
-
186
-
187
-
188
-
189
-
190
-
191
-
192
-
193
-
194
-
195
-
196
-
197
-
198
-
199
-
200
-
201
-
202
-
203
-
204
-
205
-
206
-
207
-
208
-
209
-
210
-
211
-
212
-
213
-
214
-
215
-
216
-
217
-
218
-
219
-
220
-
221
-
222
-
223
-
224
-
225
-
226
-
227
-
228
 |
 |

56
have been factored into our overall ALLL estimate through the use of loss forecasting methodologies. The level of re-defaults
will likely be affected by future economic conditions. At December 31, 2012 and December 31, 2011, specific reserves
included in the ALLL for residential TDRs were $348 million and $405 million, respectively. See Note 6, "Loans," to the
Consolidated Financial Statements in this Form 10-K for more information.
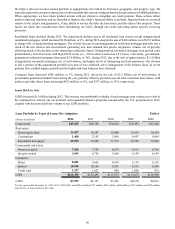
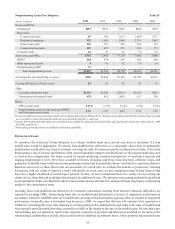
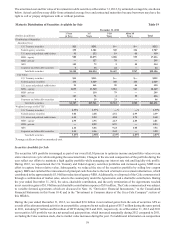
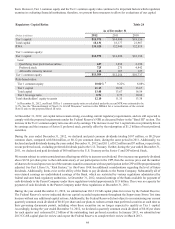
The following tables display our residential real estate TDR portfolio by modification type and payment status. Guaranteed
loans that have been repurchased from Ginnie Mae under an early buyout clause and subsequently modified have been excluded
from the table. Such loans totaled $24 million and $65 million at December 31, 2012 and December 31, 2011, respectively.
Selected Residential TDR Data Table 16
2012
Accruing TDRs Nonaccruing TDRs
(Dollars in millions) Current Delinquent1Total Current Delinquent1Total
Rate reduction $470 $37 $507 $36 $45 $81
Term extension 16 4 20 3 7 10
Rate reduction and term extension 1,562 172 1,734 78 209 287
Other 2, 3 7 2 9 172 39 211
Total $2,055 $215 $2,270 $289 $300 $589
2011
Accruing TDRs Nonaccruing TDRs
(Dollars in millions) Current Delinquent1Total Current Delinquent1Total
Rate reduction $473 $40 $513 $16 $69 $85
Term extension 20 10 30 2 24 26
Rate reduction and term extension 1,682 290 1,972 35 439 474
Other 220 3 23 2 15 17
Total $2,195 $343 $2,538 $55 $547 $602
1 TDRs considered delinquent for purposes of this table were those at least thirty days past due.
2 Primarily consists of extensions and deficiency notes.
3 Includes $201 million of nonaccruing loans discharged in Chapter 7 bankruptcy and not reaffirmed by the borrower.
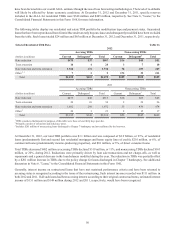
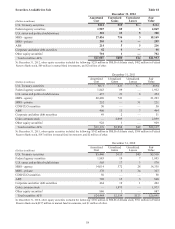
At December 31, 2012, our total TDR portfolio was $3.1 billion and was composed of $2.9 billion, or 91%, of residential
loans (predominantly first and second lien residential mortgages and home equity lines of credit), $201 million, or 6%, of
commercial loans (predominantly income-producing properties), and $81 million, or 3%, of direct consumer loans.
Total TDRs decreased $482 million as accruing TDRs declined $319 million, or 11%, and nonaccruing TDRs declined $163
million, or 20%, during 2012. Reductions were primarily driven by loan sale transactions and net charge-offs, as well as
repayments and a general decrease in the loan balances modified during the year. The reduction in TDRs was partially offset
by a $201 million increase in TDRs due to the policy change for loans discharged in Chapter 7 bankruptcy. See additional
discussion in Note 6, "Loans," to the Consolidated Financial Statements in this Form 10-K.
Generally, interest income on restructured loans that have met sustained performance criteria and have been returned to
accruing status is recognized according to the terms of the restructuring. Such interest income recorded was $111 million in
both 2012 and 2011. If all such loans had been accruing interest according to their original contractual terms, estimated interest
income of $151 million and $149 million during 2012 and 2011, respectively, would have been recognized.