SunTrust 2012 Annual Report Download - page 64
Download and view the complete annual report
Please find page 64 of the 2012 SunTrust annual report below. You can navigate through the pages in the report by either clicking on the pages listed below, or by using the keyword search tool below to find specific information within the annual report.-
 1
1 -
2
-
3
-
4
-
5
-
6
-
7
-
8
-
9
-
10
-
11
-
12
-
13
-
14
-
15
-
16
-
17
-
18
-
19
-
20
-
21
-
22
-
23
-
24
-
25
-
26
-
27
-
28
-
29
-
30
-
31
-
32
-
33
-
34
-
35
-
36
-
37
-
38
-
39
-
40
-
41
-
42
-
43
-
44
-
45
-
46
-
47
-
48
-
49
-
50
-
51
-
52
-
53
-
 54
54 -
 55
55 -
 56
56 -
 57
57 -
 58
58 -
 59
59 -
 60
60 -
 61
61 -
 62
62 -
 63
63 -
 64
64 -
 65
65 -
 66
66 -
 67
67 -
 68
68 -
 69
69 -
 70
70 -
 71
71 -
 72
72 -
 73
73 -
 74
74 -
75
-
76
-
77
-
78
-
79
-
80
-
81
-
82
-
83
-
84
-
85
-
86
-
87
-
88
-
89
-
90
-
91
-
92
-
93
-
94
-
95
-
96
-
97
-
98
-
99
-
100
-
101
-
102
-
103
-
104
-
105
-
106
-
107
-
108
-
109
-
110
-
111
-
112
-
113
-
114
-
115
-
116
-
117
-
118
-
119
-
120
-
121
-
122
-
123
-
124
-
125
-
126
-
127
-
128
-
129
-
130
-
131
-
132
-
133
-
134
-
135
-
136
-
137
-
138
-
139
-
140
-
141
-
142
-
143
-
144
-
145
-
146
-
147
-
148
-
149
-
150
-
151
-
152
-
153
-
154
-
155
-
156
-
157
-
158
-
159
-
160
-
161
-
162
-
163
-
164
-
165
-
166
-
167
-
168
-
169
-
170
-
171
-
172
-
173
-
174
-
175
-
176
-
177
-
178
-
179
-
180
-
181
-
182
-
183
-
184
-
185
-
186
-
187
-
188
-
189
-
190
-
191
-
192
-
193
-
194
-
195
-
196
-
197
-
198
-
199
-
200
-
201
-
202
-
203
-
204
-
205
-
206
-
207
-
208
-
209
-
210
-
211
-
212
-
213
-
214
-
215
-
216
-
217
-
218
-
219
-
220
-
221
-
222
-
223
-
224
-
225
-
226
-
227
-
228
 |
 |

48
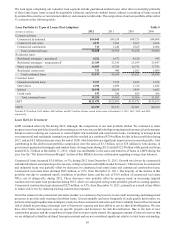
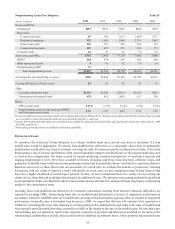
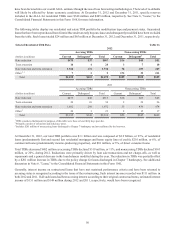
The following table shows the percentage breakdown of our total LHFI portfolio by geographic region:
Loan Types by Geography Table 9
Commercial Residential Consumer
2012 2011 2012 2011 2012 2011
Geography:
Central127% 28% 21% 21% 15% 14%
Florida219 20 26 27 19 18
MidAtlantic325 26 38 36 26 25
Other 29 26 15 16 40 43
Total 100% 100% 100% 100% 100% 100%
1 The Central region includes Alabama, Arkansas, Georgia, Mississippi, and Tennessee.
2 The Florida region includes Florida only.
3 The MidAtlantic region includes the District of Columbia, Maryland, North Carolina, South Carolina, and Virginia.
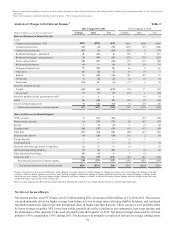
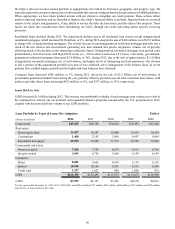
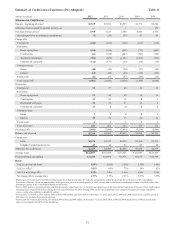
Asset Quality
Our overall asset quality continued to demonstrate favorable trends during 2012, as NPL sales contributed to the decline in
nonperforming assets during 2012. NPLs declined 47% from December 31, 2011, and totaled $1.5 billion at December 31,
2012. Net charge-offs decreased $359 million, or 18%, during 2012, compared to 2011. The net charge-off ratio fell to 1.37%
during 2012, compared to 1.75% in 2011. Early stage delinquencies, excluding government-guaranteed loans, improved to
0.48% of total loans at December 31, 2012 from 0.68% at December 31, 2011. Total early stage delinquencies also improved
to 0.93% at December 31, 2012 from 1.17% at December 31, 2011. The gradual improvement in our asset quality trends was
driven by the intentional reduction of our higher-risk loan balances combined with a reduction in inflows of NPLs. These
items, coupled with our loan sales during 2012 and our level of government-guaranteed loans at December 31, 2012, have
resulted in an improved risk profile and a loan portfolio that more closely aligns with our longer-term balance sheet targets.
Our nonperforming loans have declined significantly since their peak in 2009, down by $4.0 billion, or 72%, and during 2012
we took actions that further accelerated this decline by selling approximately $647 million of mortgage and commercial real
estate NPLs, net of charge-offs. At December 31, 2012, the percentage of NPLs to total loans was 1.27%, down 110 basis
points from December 31, 2011. We expect NPLs to continue to trend down in 2013 as asset quality improves and loans move
through the foreclosure process.
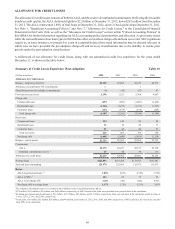
Net charge-offs totaled $1.7 billion during 2012, compared to $2.0 billion during 2011. Included in 2012 was $226 million
in charge-offs associated with the sale of mortgage and commercial real estate NPLs, $79 million in charge-offs from the
changes in policy related to loans discharged in Chapter 7 bankruptcy, and $65 million in charge-offs from the second lien
credit policy change, both of which are further discussed in Note 1, "Significant Accounting Policies," to the Consolidated
Financial Statements in this Form 10-K and the "Allowance for Credit Losses" section of this MD&A. Net charge-offs have
trended favorably for several quarters, and we expect that trend to continue in the coming quarters.
Early stage delinquencies of 0.93%, reached their lowest level in several quarters at December 31, 2012, led by a 47 basis
point decrease from year end 2011 in residential loans. At December 31, 2012, all residential loan classes showed improvement
compared to December 31, 2011, with nonguaranteed residential mortgages demonstrating the largest improvement, declining
57 basis points. We expect future early stage delinquency ratio improvements to be driven by residential loans, as they are
still elevated by historical standards. The overall economy, particularly changes in unemployment, will influence any additional
improvement.
Overall, we are pleased with our improved risk profile and positive trends in credit metrics. As we look forward, a recovering
economy should continue to support our positive asset quality trends, with additional improvements propelled by the residential
portfolio, as most of the commercial and consumer portfolios are currently approaching more normal credit quality levels.