SunTrust 2012 Annual Report Download - page 102
Download and view the complete annual report
Please find page 102 of the 2012 SunTrust annual report below. You can navigate through the pages in the report by either clicking on the pages listed below, or by using the keyword search tool below to find specific information within the annual report.-
 1
1 -
2
-
3
-
4
-
5
-
6
-
7
-
8
-
9
-
10
-
11
-
12
-
13
-
14
-
15
-
16
-
17
-
18
-
19
-
20
-
21
-
22
-
23
-
24
-
25
-
26
-
27
-
28
-
29
-
30
-
31
-
32
-
33
-
34
-
35
-
36
-
37
-
38
-
39
-
40
-
41
-
42
-
43
-
44
-
45
-
46
-
47
-
48
-
49
-
50
-
51
-
52
-
53
-
54
-
55
-
56
-
57
-
58
-
59
-
60
-
61
-
62
-
63
-
64
-
65
-
66
-
67
-
68
-
69
-
70
-
71
-
72
-
73
-
74
-
75
-
76
-
77
-
78
-
79
-
80
-
81
-
82
-
83
-
84
-
85
-
86
-
87
-
88
-
89
-
90
-
91
-
 92
92 -
 93
93 -
 94
94 -
 95
95 -
 96
96 -
 97
97 -
 98
98 -
 99
99 -
 100
100 -
 101
101 -
 102
102 -
 103
103 -
 104
104 -
 105
105 -
 106
106 -
 107
107 -
 108
108 -
 109
109 -
 110
110 -
 111
111 -
 112
112 -
113
-
114
-
115
-
116
-
117
-
118
-
119
-
120
-
121
-
122
-
123
-
124
-
125
-
126
-
127
-
128
-
129
-
130
-
131
-
132
-
133
-
134
-
135
-
136
-
137
-
138
-
139
-
140
-
141
-
142
-
143
-
144
-
145
-
146
-
147
-
148
-
149
-
150
-
151
-
152
-
153
-
154
-
155
-
156
-
157
-
158
-
159
-
160
-
161
-
162
-
163
-
164
-
165
-
166
-
167
-
168
-
169
-
170
-
171
-
172
-
173
-
174
-
175
-
176
-
177
-
178
-
179
-
180
-
181
-
182
-
183
-
184
-
185
-
186
-
187
-
188
-
189
-
190
-
191
-
192
-
193
-
194
-
195
-
196
-
197
-
198
-
199
-
200
-
201
-
202
-
203
-
204
-
205
-
206
-
207
-
208
-
209
-
210
-
211
-
212
-
213
-
214
-
215
-
216
-
217
-
218
-
219
-
220
-
221
-
222
-
223
-
224
-
225
-
226
-
227
-
228
 |
 |

86
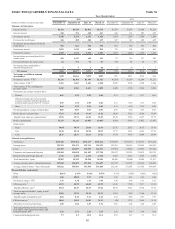
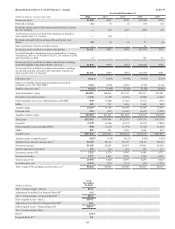
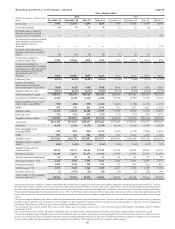
SELECTED QUARTERLY FINANCIAL DATA Table 36
Three Months Ended
2012 2011
(Dollars in millions, except per share data) December 31 September 30 June 30 March 31 December 31 September 30 June 30 March 31
Summary of Operations:
Interest income $1,396 $1,445 $1,492 $1,534 $1,543 $1,538 $1,546 $1,554
Interest expense 150 174 218 223 249 275 287 305
Net interest income 1,246 1,271 1,274 1,311 1,294 1,263 1,259 1,249
Provision for credit losses 328 450 300 317 327 347 392 447
Net interest income after provision for
credit losses 918 821 974 994 967 916 867 802
Noninterest income11,015 2,542 940 876 723 903 912 883
Noninterest expense 1,510 1,726 1,546 1,541 1,667 1,560 1,542 1,465
Income before provision/(benefit) for
income taxes 423 1,637 368 329 23 259 237 220
Provision/(benefit) for income taxes 62 551 91 69 (57) 45 58 33
Net income/(loss) attributable to
noncontrolling interest 5 9 2 10 6(1) 1 7
Net income $356 $1,077 $275 $250 $74 $215 $178 $180
Net income available to common
shareholders $350 $1,066 $270 $245 $71 $211 $174 $38
Net interest income - FTE 2$1,276 $1,301 $1,306 $1,342 $1,324 $1,293 $1,286 $1,277
Total revenue - FTE 1,2 2,291 3,843 2,246 2,218 2,047 2,196 2,198 2,160
Total revenue - FTE, excluding net
securities gains 2 2,290 1,902 2,232 2,200 2,028 2,194 2,166 2,096
Net income per average common share:
Diluted 0.65 1.98 0.50 0.46 0.13 0.39 0.33 0.08
Diluted excluding effect of accelerated
accretion associated with the repurchase of
preferred stock issued to the U.S. Treasury 20.65 1.98 0.50 0.46 0.13 0.39 0.33 0.22
Basic 0.66 1.99 0.51 0.46 0.13 0.40 0.33 0.08
Dividends paid per average common share 0.05 0.05 0.05 0.05 0.05 0.05 0.01 0.01
Book value per common share 37.59 37.35 37.69 37.11 36.86 37.29 36.30 35.49
Tangible book value per common share 225.98 25.72 26.02 25.49 25.18 25.60 24.57 23.79
Market capitalization 15,279 15,232 13,045 13,005 9,504 9,639 13,852 15,482
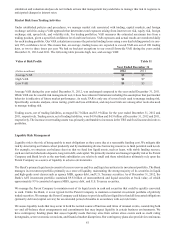
Market price:
High 30.64 30.79 24.83 24.93 21.31 26.52 30.13 33.14
Low 25.30 22.34 20.96 18.07 15.79 16.51 24.63 27.38
Close 28.35 28.27 24.23 24.17 17.70 17.95 25.80 28.84
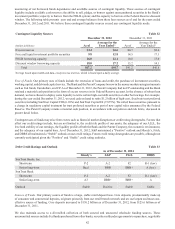
Selected Average Balances
Total assets $173,442 $173,181 $178,257 $178,226 $174,085 $172,076 $170,527 $173,066
Earning assets 151,223 152,472 153,939 154,950 151,561 146,836 145,985 146,786
Loans 121,470 121,817 124,560 122,691 119,474 115,638 114,920 115,162
Consumer and commercial deposits 130,180 124,898 126,145 127,718 125,072 122,974 121,879 120,710
Brokered time and foreign deposits 2,136 2,328 2,258 2,314 2,293 2,312 2,340 2,606
Total shareholders’ equity 20,985 20,399 20,568 20,241 20,208 20,000 19,509 23,107
Average common shares - diluted (thousands) 539,618 538,699 537,495 536,407 535,717 535,395 535,416 503,503
Average common shares - basic (thousands) 535,012 534,506 533,964 533,100 532,146 531,928 531,792 499,669
Financial Ratios (Annualized)
ROA 0.81% 2.45% 0.62% 0.57% 0.17% 0.50% 0.42% 0.42%
ROE 6.86 20.84 5.37 4.94 1.41 4.23 3.61 0.84
Net interest margin - FTE 3.36 3.38 3.39 3.49 3.46 3.49 3.53 3.53
Efficiency ratio 365.93 44.90 68.83 69.50 81.45 71.05 70.17 67.83
Tangible efficiency ratio 265.63 44.47 68.33 69.02 80.99 70.55 69.64 67.32
Total average shareholders’ equity to total
average assets 11.82 11.76 11.51 11.45 11.61 11.62 11.44 13.35
Tangible equity to tangible assets 28.82 8.48 8.31 8.14 8.10 8.38 8.07 7.87
Effective tax rate 414.86 33.82 24.85 21.55 NM 17.33 24.45 15.54
Allowance to year-end total loans 1.80 1.84 1.85 1.92 2.01 2.22 2.40 2.49
Total nonperforming assets to total loans
plus OREO, other repossessed assets, and
nonperforming LHFS 1.52 1.71 2.24 2.54 2.76 3.19 3.56 3.95
Common dividend payout ratio 7.7 2.5 10.0 11.0 37.6 12.7 3.1 13.2