SunTrust 2012 Annual Report Download - page 71
Download and view the complete annual report
Please find page 71 of the 2012 SunTrust annual report below. You can navigate through the pages in the report by either clicking on the pages listed below, or by using the keyword search tool below to find specific information within the annual report.-
 1
1 -
2
-
3
-
4
-
5
-
6
-
7
-
8
-
9
-
10
-
11
-
12
-
13
-
14
-
15
-
16
-
17
-
18
-
19
-
20
-
21
-
22
-
23
-
24
-
25
-
26
-
27
-
28
-
29
-
30
-
31
-
32
-
33
-
34
-
35
-
36
-
37
-
38
-
39
-
40
-
41
-
42
-
43
-
44
-
45
-
46
-
47
-
48
-
49
-
50
-
51
-
52
-
53
-
54
-
55
-
56
-
57
-
58
-
59
-
60
-
 61
61 -
 62
62 -
 63
63 -
 64
64 -
 65
65 -
 66
66 -
 67
67 -
 68
68 -
 69
69 -
 70
70 -
 71
71 -
 72
72 -
 73
73 -
 74
74 -
 75
75 -
 76
76 -
 77
77 -
 78
78 -
 79
79 -
 80
80 -
 81
81 -
82
-
83
-
84
-
85
-
86
-
87
-
88
-
89
-
90
-
91
-
92
-
93
-
94
-
95
-
96
-
97
-
98
-
99
-
100
-
101
-
102
-
103
-
104
-
105
-
106
-
107
-
108
-
109
-
110
-
111
-
112
-
113
-
114
-
115
-
116
-
117
-
118
-
119
-
120
-
121
-
122
-
123
-
124
-
125
-
126
-
127
-
128
-
129
-
130
-
131
-
132
-
133
-
134
-
135
-
136
-
137
-
138
-
139
-
140
-
141
-
142
-
143
-
144
-
145
-
146
-
147
-
148
-
149
-
150
-
151
-
152
-
153
-
154
-
155
-
156
-
157
-
158
-
159
-
160
-
161
-
162
-
163
-
164
-
165
-
166
-
167
-
168
-
169
-
170
-
171
-
172
-
173
-
174
-
175
-
176
-
177
-
178
-
179
-
180
-
181
-
182
-
183
-
184
-
185
-
186
-
187
-
188
-
189
-
190
-
191
-
192
-
193
-
194
-
195
-
196
-
197
-
198
-
199
-
200
-
201
-
202
-
203
-
204
-
205
-
206
-
207
-
208
-
209
-
210
-
211
-
212
-
213
-
214
-
215
-
216
-
217
-
218
-
219
-
220
-
221
-
222
-
223
-
224
-
225
-
226
-
227
-
228
 |
 |
55
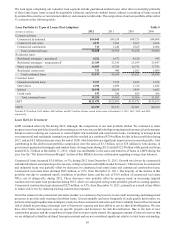
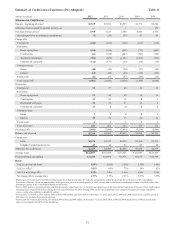
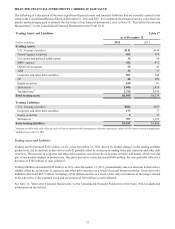
Nonperforming Assets (Pre-Adoption) Table 15
(Dollars in millions) 2012 2011 2010 2009 2008
Nonaccrual/NPLs:
Commercial $103 $127 $255 $484 $322
Real estate:
Construction loans 85 390 1,013 1,484 1,277
Residential mortgages 925 1,655 1,988 2,716 1,847
Home equity lines 281 273 285 289 272
Commercial real estate 127 431 531 392 177
Consumer loans 26 27 38 37 45
Total nonaccrual/NPLs 1,547 2,903 4,110 5,402 3,940
OREO1264 479 596 620 500
Other repossessed assets 910 52 79 16
Nonperforming LHFS 37 — — — —
Total nonperforming assets $1,857 $3,392 $4,758 $6,101 $4,456
Accruing loans past due 90 days or more2$782 $2,028 $1,565 $1,500 $1,032
Accruing LHFS past due 90 days or more $1 $3 $2 $2 $1
TDRs:
Accruing restructured loans $2,501 $2,820 $2,613 $1,641 $463
Nonaccruing restructured loans3639 802 1,005 913 268
Ratios:
NPLs to total loans 1.27% 2.37% 3.54% 4.75% 3.10%
Nonperforming assets to total loans plus OREO
and other repossessed assets 1.52 2.76 4.08 5.33 3.49
1Does not include foreclosed real estate related to serviced loans insured by the FHA or the VA. Insurance proceeds due from the FHA and the VA are recorded
as a receivable in other assets until the funds are received and the property is conveyed.
2Includes $979 million and $494 million of consolidated loans eligible for repurchase from Ginnie Mae and classified as held for sale at December 31, 2009
and 2008, respectively.
3Nonaccruing restructured loans are included in total nonaccrual/NPLs.
Restructured Loans
To maximize the collection of loan balances, we evaluate troubled loans on a case-by-case basis to determine if a loan
modification would be appropriate. We pursue loan modifications when there is a reasonable chance that an appropriate
modification would allow our client to continue servicing the debt. For loans secured by residential real estate, if the client
demonstrates a loss of income such that the client cannot reasonably support a modified loan, we may pursue short sales and/
or deed-in-lieu arrangements. For loans secured by income producing commercial properties, we perform a rigorous and
ongoing programmatic review. We review a number of factors, including cash flows, loan structures, collateral values, and
guarantees to identify loans within our income producing commercial loan portfolio that are most likely to experience distress.
Based on our review of these factors and our assessment of overall risk, we evaluate the benefits of proactively initiating
discussions with our clients to improve a loan’s risk profile. In some cases, we may renegotiate terms of their loans so that
they have a higher likelihood of continuing to perform. To date, we have restructured loans in a variety of ways to help our
clients service their debt and to mitigate the potential for additional losses. The primary restructuring methods being offered
to our residential clients are reductions in interest rates and extensions of terms. For commercial loans, the primary restructuring
method is the extensions of terms.
Accruing loans with modifications deemed to be economic concessions resulting from borrower financial difficulties are
reported as accruing TDRs. Nonaccruing loans that are modified and demonstrate a history of repayment performance in
accordance with their modified terms are reclassified to accruing restructured status, typically after six months of repayment
performance. Generally, once a residential loan becomes a TDR, we expect that the loan will continue to be reported as a
TDR for its remaining life even after returning to accruing status as the modified rates and terms at the time of modification
were typically more favorable than those generally available in the market at the time of the modification. We note that some
restructurings may not ultimately result in the complete collection of principal and interest (as modified by the terms of the
restructuring), culminating in default, which could result in additional incremental losses. These potential incremental losses