SunTrust 2012 Annual Report Download - page 88
Download and view the complete annual report
Please find page 88 of the 2012 SunTrust annual report below. You can navigate through the pages in the report by either clicking on the pages listed below, or by using the keyword search tool below to find specific information within the annual report.-
 1
1 -
2
-
3
-
4
-
5
-
6
-
7
-
8
-
9
-
10
-
11
-
12
-
13
-
14
-
15
-
16
-
17
-
18
-
19
-
20
-
21
-
22
-
23
-
24
-
25
-
26
-
27
-
28
-
29
-
30
-
31
-
32
-
33
-
34
-
35
-
36
-
37
-
38
-
39
-
40
-
41
-
42
-
43
-
44
-
45
-
46
-
47
-
48
-
49
-
50
-
51
-
52
-
53
-
54
-
55
-
56
-
57
-
58
-
59
-
60
-
61
-
62
-
63
-
64
-
65
-
66
-
67
-
68
-
69
-
70
-
71
-
72
-
73
-
74
-
75
-
76
-
77
-
 78
78 -
 79
79 -
 80
80 -
 81
81 -
 82
82 -
 83
83 -
 84
84 -
 85
85 -
 86
86 -
 87
87 -
 88
88 -
 89
89 -
 90
90 -
 91
91 -
 92
92 -
 93
93 -
 94
94 -
 95
95 -
 96
96 -
 97
97 -
 98
98 -
99
-
100
-
101
-
102
-
103
-
104
-
105
-
106
-
107
-
108
-
109
-
110
-
111
-
112
-
113
-
114
-
115
-
116
-
117
-
118
-
119
-
120
-
121
-
122
-
123
-
124
-
125
-
126
-
127
-
128
-
129
-
130
-
131
-
132
-
133
-
134
-
135
-
136
-
137
-
138
-
139
-
140
-
141
-
142
-
143
-
144
-
145
-
146
-
147
-
148
-
149
-
150
-
151
-
152
-
153
-
154
-
155
-
156
-
157
-
158
-
159
-
160
-
161
-
162
-
163
-
164
-
165
-
166
-
167
-
168
-
169
-
170
-
171
-
172
-
173
-
174
-
175
-
176
-
177
-
178
-
179
-
180
-
181
-
182
-
183
-
184
-
185
-
186
-
187
-
188
-
189
-
190
-
191
-
192
-
193
-
194
-
195
-
196
-
197
-
198
-
199
-
200
-
201
-
202
-
203
-
204
-
205
-
206
-
207
-
208
-
209
-
210
-
211
-
212
-
213
-
214
-
215
-
216
-
217
-
218
-
219
-
220
-
221
-
222
-
223
-
224
-
225
-
226
-
227
-
228
 |
 |
72
Trading Assets and Liabilities and Securities AFS
In estimating the fair values for the majority of securities AFS and trading instruments, including residual and certain other
retained securitization interests, fair values are based on observable market prices of the same or similar instruments.
Specifically, the majority of trading assets and liabilities are priced by the respective trading desk and the majority of securities
AFS are priced by an independent third party pricing service. We have an internal, yet independent validation function in
place to evaluate the appropriateness of the marks received from third party pricing services. For trading securities and
securities AFS in active trading markets, this can be done by comparing the marks against two to three other widely used third
party pricing services or sources. For less liquid instruments, we evaluate third party pricing to determine the reasonableness
of the information relative to changes in market data such as any recent trades we executed, market information received from
outside market participants and analysts, and/or changes in the underlying collateral performance.
We also gather third party broker quotes or use industry-standard or proprietary models to estimate the fair value of these
instruments particularly when pricing service information or observable market trades are not available. In most cases, the
current market conditions caused the broker quotes to be indicative and the price indications and broker quotes to be supported
by very limited to no recent market activity. In those instances, we weighted the third party information according to our
judgment of it being a reasonable indication of the instrument's fair value.
When fair values are estimated based on models, we consider relevant market indices that correlate to the underlying collateral,
along with assumptions such as liquidity discounts, interest rates, prepayment speeds, default rates, loss severity rates, and
discount rates. As liquidity returns to certain markets, we have more pricing information from third parties and a reduction
in the need to use internal pricing models to estimate fair value. Even when third party pricing is available, we continued to
classify certain assets as level 3 as we believe that this third party pricing relied on significant unobservable assumptions, as
evidenced by a persistently wide bid-ask price range and variability in pricing from the pricing services, particularly for the
vintages and exposures we hold.
As certain markets recover, we are able to reduce our exposure to many of our level 3 instruments through sales, maturities,
or other distributions at prices approximating our previous estimates; thereby corroborating the valuation approaches used.
Many of our remaining level 3 securities, however, will be held until final distribution or maturity. While it is difficult to
accurately predict the ultimate cash value of these securities, we believe the amount that would be ultimately realized if the
securities were held to settlement or maturity will generally be similar to or greater than the current fair value of the securities
classified as level 3. This assessment is based on the current performance of the underlying collateral, which is experiencing
elevated losses but generally not to the degree that correlates to current market values, which reflect downward pressure due
to liquidity issues and other broader macro-economic conditions. It is reasonably likely that market volatility for certain
instruments will continue as a result of a variety of external factors. This lack of liquidity has caused us to evaluate the
performance of the underlying collateral and to use a discount rate commensurate with the rate a market participant would
use to value the instrument in an orderly transaction, but that also acknowledges illiquidity premiums and required investor
rates of return that would be demanded under current market conditions. The discount rate considered the capital structure of
the instrument, market indices, and the relative yields of instruments for which third party pricing information and/or market
activity was available. In certain instances, the interest rate and credit risk components of the valuation indicated a full return
of expected principal and interest; however, the lack of liquidity resulted in wide ranges of discounts in valuing certain level
3 instruments. The illiquidity that continues to persist in certain markets requires discounts of this degree to drive a market
competitive yield, as well as to account for the anticipated extended tenor. The discount rates selected derived reasonable
prices when compared to (i) observable transactions, when available, (ii) other securities on a relative basis, (iii) the bid/ask
spread of non-binding broker indicative bids, and/or (iv) our professional judgment.
All of the techniques used and information obtained in the valuation process provide a range of estimated values, which were
evaluated and compared in order to establish an estimated value that, based on management's judgment, represented a
reasonable estimate of the instrument's fair value. It was not uncommon for the range of value of these instruments to vary
widely; in such cases, we selected an estimated value that we believed was the best indication of value based on the yield a
market participant in this current environment would expect. Due to the continued illiquidity and credit risk of level 3 securities,
these market values are highly sensitive to assumption changes and market volatility. Improvements may be made to our
pricing methodologies on an ongoing basis as observable and relevant information becomes available to us.
Most derivative instruments are level 1 or level 2 instruments, except for the IRLCs and the Visa litigation related derivative,
which are level 3 instruments. See Note 16, “Derivative Financial Instruments,” to the Consolidated Financial Statements in
this Form 10-K for a detailed discussion regarding derivative contracts and valuation.
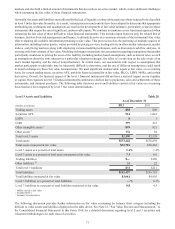
At December 31, 2012, level 3 trading assets and level 3 securities AFS totaled $58 million and $914 million, respectively.
Our level 3 securities AFS portfolio included FHLB and Federal Reserve Bank stock, as well as certain municipal bond