SunTrust 2012 Annual Report Download - page 173
Download and view the complete annual report
Please find page 173 of the 2012 SunTrust annual report below. You can navigate through the pages in the report by either clicking on the pages listed below, or by using the keyword search tool below to find specific information within the annual report.-
 1
1 -
2
-
3
-
4
-
5
-
6
-
7
-
8
-
9
-
10
-
11
-
12
-
13
-
14
-
15
-
16
-
17
-
18
-
19
-
20
-
21
-
22
-
23
-
24
-
25
-
26
-
27
-
28
-
29
-
30
-
31
-
32
-
33
-
34
-
35
-
36
-
37
-
38
-
39
-
40
-
41
-
42
-
43
-
44
-
45
-
46
-
47
-
48
-
49
-
50
-
51
-
52
-
53
-
54
-
55
-
56
-
57
-
58
-
59
-
60
-
61
-
62
-
63
-
64
-
65
-
66
-
67
-
68
-
69
-
70
-
71
-
72
-
73
-
74
-
75
-
76
-
77
-
78
-
79
-
80
-
81
-
82
-
83
-
84
-
85
-
86
-
87
-
88
-
89
-
90
-
91
-
92
-
93
-
94
-
95
-
96
-
97
-
98
-
99
-
100
-
101
-
102
-
103
-
104
-
105
-
106
-
107
-
108
-
109
-
110
-
111
-
112
-
113
-
114
-
115
-
116
-
117
-
118
-
119
-
120
-
121
-
122
-
123
-
124
-
125
-
126
-
127
-
128
-
129
-
130
-
131
-
132
-
133
-
134
-
135
-
136
-
137
-
138
-
139
-
140
-
141
-
142
-
143
-
144
-
145
-
146
-
147
-
148
-
149
-
150
-
151
-
152
-
153
-
154
-
155
-
156
-
157
-
158
-
159
-
160
-
161
-
162
-
 163
163 -
 164
164 -
 165
165 -
 166
166 -
 167
167 -
 168
168 -
 169
169 -
 170
170 -
 171
171 -
 172
172 -
 173
173 -
 174
174 -
 175
175 -
 176
176 -
 177
177 -
 178
178 -
 179
179 -
 180
180 -
 181
181 -
 182
182 -
 183
183 -
184
-
185
-
186
-
187
-
188
-
189
-
190
-
191
-
192
-
193
-
194
-
195
-
196
-
197
-
198
-
199
-
200
-
201
-
202
-
203
-
204
-
205
-
206
-
207
-
208
-
209
-
210
-
211
-
212
-
213
-
214
-
215
-
216
-
217
-
218
-
219
-
220
-
221
-
222
-
223
-
224
-
225
-
226
-
227
-
228
 |
 |
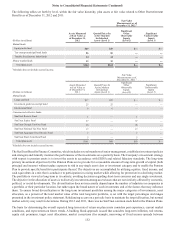
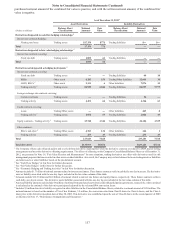
Notes to Consolidated Financial Statements (Continued)
157
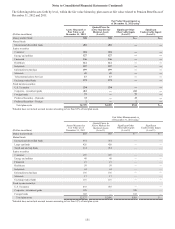
purchased notional amount if the combined fair value is positive, and with the written notional amount, if the combined fair
value is negative.
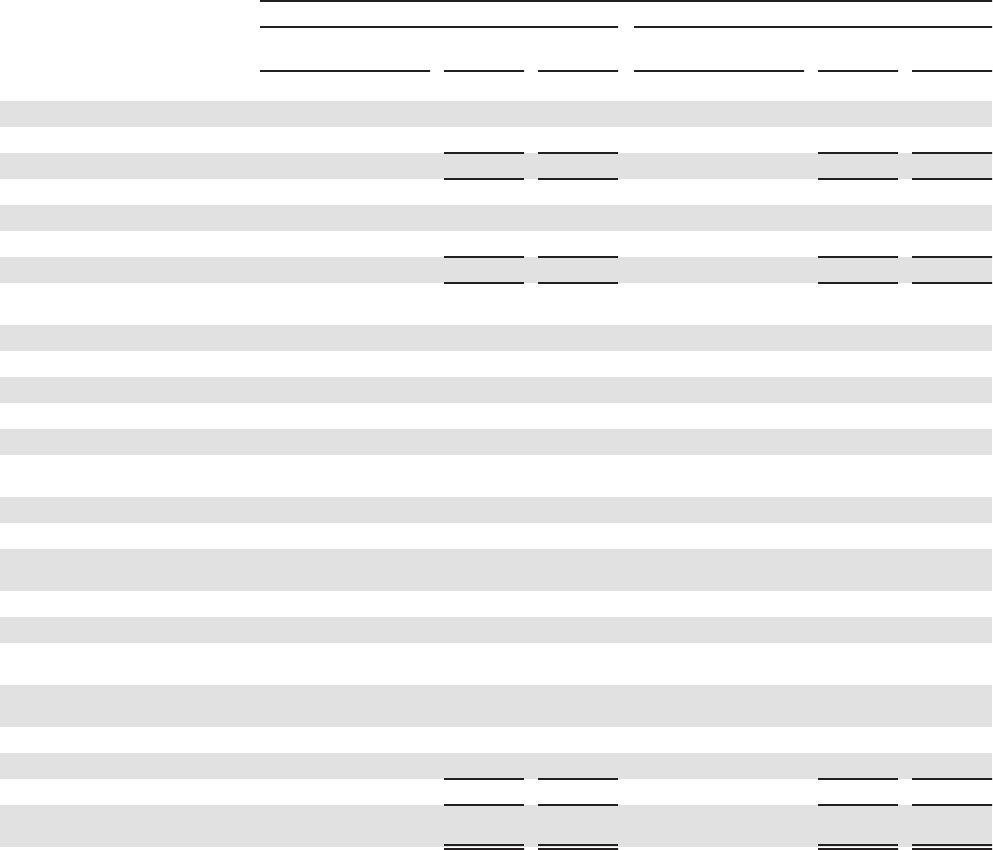
As of December 31, 20121
Asset Derivatives Liability Derivatives
(Dollars in millions)
Balance Sheet
Classification Notional
Amounts Fair
Value Balance Sheet
Classification Notional
Amounts Fair
Value
Derivatives designated in cash flow hedging relationships 2
Interest rate contracts hedging:
Floating rate loans Trading assets $17,350 $771 Trading liabilities $— $—
Total 17,350 771 — —
Derivatives designated in fair value hedging relationships 3
Interest rate contracts covering:
Fixed rate debt Trading assets 1,000 61 Trading liabilities — —
Total 1,000 61 — —
Derivatives not designated as hedging instruments 4
Interest rate contracts covering:
Fixed rate debt Trading assets — — Trading liabilities 60 10
MSRs Other assets 6,185 150 Trading/Other liabilities 12,643 33
LHFS, IRLCs 5Other assets 2,333 6 Other liabilities 7,076 15
Trading activity 6Trading assets 81,930 6,044 Trading liabilities 86,037 5,777
Foreign exchange rate contracts covering:
Commercial loans Trading assets — — Trading liabilities 34 —
Trading activity Trading assets 2,451 66 Trading liabilities 2,326 63
Credit contracts covering:
Loans Trading/Other assets — — Other liabilities 445 8
Trading activity 7Trading assets 1,958 55 Trading liabilities 2,081 49
Equity contracts - Trading activity 6Trading assets 15,748 1,342 Trading liabilities 22,184 1,529
Other contracts:
IRLCs and other 8Trading/Other assets 6,783 132 Other liabilities 142 1
Trading activity Trading assets 255 29 Trading liabilities 255 29
Total 117,643 7,824 133,283 7,514
Total derivatives $135,993 $8,656 $133,283 $7,514
1 The Company offsets cash collateral paid to and received from derivative counterparties when the derivative contracts are subject to ISDA master netting
arrangements and meet the derivative offsetting requirements. The effects of offsetting on the Company's Consolidated Balance Sheets as of December 31,
2012, are presented in Note 18, "Fair Value Election and Measurement." In some situations, trading derivatives are offset with derivatives used for risk
management purposes that are recorded in other assets or other liabilities. As a result, the Company may reclass balances between trading assets or liabilities
and other assets or other liabilities based on the predominant account.
2 See “Cash Flow Hedges” in this Note for further discussion.
3 See “Fair Value Hedges” in this Note for further discussion.
4 See “Economic Hedging and Trading Activities” in this Note for further discussion.
5 Amount includes $1.7 billion of notional amounts related to interest rate futures. These futures contracts settle in cash daily, one day in arrears. The derivative
asset or liability associated with the one day lag is included in the fair value column of this table.
6 Amounts include $16.2 billion and $0.8 billion of notional related to interest rate futures and equity futures, respectively. These futures contracts settle in
cash daily, one day in arrears. The derivative assets/liabilities associated with the one day lag are included in the fair value column of this table.
7 Asset and liability amounts each include $3 million of notional from purchased and written credit risk participation agreements, respectively, whose notional
is calculated as the notional of the derivative participated adjusted by the relevant RWA conversion factor.
8 Includes $1 million derivative liability recognized in other liabilities in the Consolidated Balance Sheets, related to a notional amount of $134 million. The
notional amount is based on the number of Visa Class B shares, 3.2 million, the conversion ratio from Class B shares to Class A shares, and the Class A
share price at the derivative inception date of May 28, 2009. This derivative was established upon the sale of Class B shares in the second quarter of 2009
as discussed in Note 17, “Reinsurance Arrangements and Guarantees.”