SunTrust 2012 Annual Report Download - page 201
Download and view the complete annual report
Please find page 201 of the 2012 SunTrust annual report below. You can navigate through the pages in the report by either clicking on the pages listed below, or by using the keyword search tool below to find specific information within the annual report.-
 1
1 -
2
-
3
-
4
-
5
-
6
-
7
-
8
-
9
-
10
-
11
-
12
-
13
-
14
-
15
-
16
-
17
-
18
-
19
-
20
-
21
-
22
-
23
-
24
-
25
-
26
-
27
-
28
-
29
-
30
-
31
-
32
-
33
-
34
-
35
-
36
-
37
-
38
-
39
-
40
-
41
-
42
-
43
-
44
-
45
-
46
-
47
-
48
-
49
-
50
-
51
-
52
-
53
-
54
-
55
-
56
-
57
-
58
-
59
-
60
-
61
-
62
-
63
-
64
-
65
-
66
-
67
-
68
-
69
-
70
-
71
-
72
-
73
-
74
-
75
-
76
-
77
-
78
-
79
-
80
-
81
-
82
-
83
-
84
-
85
-
86
-
87
-
88
-
89
-
90
-
91
-
92
-
93
-
94
-
95
-
96
-
97
-
98
-
99
-
100
-
101
-
102
-
103
-
104
-
105
-
106
-
107
-
108
-
109
-
110
-
111
-
112
-
113
-
114
-
115
-
116
-
117
-
118
-
119
-
120
-
121
-
122
-
123
-
124
-
125
-
126
-
127
-
128
-
129
-
130
-
131
-
132
-
133
-
134
-
135
-
136
-
137
-
138
-
139
-
140
-
141
-
142
-
143
-
144
-
145
-
146
-
147
-
148
-
149
-
150
-
151
-
152
-
153
-
154
-
155
-
156
-
157
-
158
-
159
-
160
-
161
-
162
-
163
-
164
-
165
-
166
-
167
-
168
-
169
-
170
-
171
-
172
-
173
-
174
-
175
-
176
-
177
-
178
-
179
-
180
-
181
-
182
-
183
-
184
-
185
-
186
-
187
-
188
-
189
-
190
-
 191
191 -
 192
192 -
 193
193 -
 194
194 -
 195
195 -
 196
196 -
 197
197 -
 198
198 -
 199
199 -
 200
200 -
 201
201 -
 202
202 -
 203
203 -
 204
204 -
 205
205 -
 206
206 -
 207
207 -
 208
208 -
 209
209 -
 210
210 -
 211
211 -
212
-
213
-
214
-
215
-
216
-
217
-
218
-
219
-
220
-
221
-
222
-
223
-
224
-
225
-
226
-
227
-
228
 |
 |

Notes to Consolidated Financial Statements (Continued)
185
2011, the Company recognized impairment charges of $2 million and $5 million, respectively, attributable to the fair value
of various personal property under operating leases.
Land held for sale is measured at the lesser of carrying value or fair value less cost to sell. The fair value of the land is
determined using broker opinions, and based on the lack of observable inputs, the land is considered level 3. During 2012,
the Company recognized a $7 million impairment charge on the land. No impairment charges were recognized during 2011.
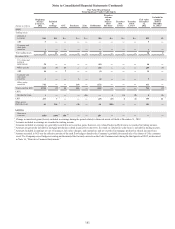
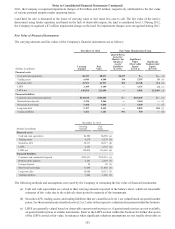
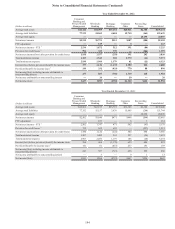
Fair Value of Financial Instruments
The carrying amounts and fair values of the Company’s financial instruments are as follows:
December 31, 2012 Fair Value Measurement Using
(Dollars in millions) Carrying
Amount Fair
Value
Quoted Prices
In Active
Markets for
Identical
Assets/
Liabilities
(Level 1)
Significant
Other
Observable
Inputs
(Level 2)
Significant
Unobservable
Inputs
(Level 3)
Financial assets
Cash and cash equivalents $8,257 $8,257 $8,257 $— $— (a)
Trading assets 6,049 6,049 394 5,597 58 (b)
Securities AFS 21,953 21,953 291 20,748 914 (b)
LHFS 3,399 3,399 — 3,375 24 (c)
LHFI, net 119,296 115,690 — 4,041 111,649 (d)
Financial liabilities
Consumer and commercial deposits $130,180 $130,449 $— $130,449 $— (e)
Brokered time deposits 2,136 2,164 — 2,164 — (f)
Short-term borrowings 5,494 5,494 — 5,494 — (f)
Long-term debt 9,357 9,413 — 8,829 584 (f)
Trading liabilities 1,161 1,161 591 570 — (b)
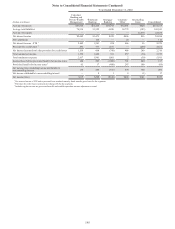
December 31, 2011
(Dollars in millions)
Carrying
Amount
Fair
Value
Financial assets
Cash and cash equivalents $4,509 $4,509 (a)
Trading assets 6,279 6,279 (b)
Securities AFS 28,117 28,117 (b)
LHFS 2,353 2,355 (c)
LHFI, net 120,038 115,685 (d)
Financial liabilities
Consumer and commercial deposits $125,611 $125,963 (e)
Brokered time deposits 2,281 2,289 (f)
Foreign deposits 30 30 (f)
Short-term borrowings 11,466 11,466 (f)
Long-term debt 10,908 10,515 (f)
Trading liabilities 1,806 1,806 (b)
The following methods and assumptions were used by the Company in estimating the fair value of financial instruments:
(a) Cash and cash equivalents are valued at their carrying amounts reported in the balance sheet, which are reasonable
estimates of fair value due to the relatively short period to maturity of the instruments.
(b) Securities AFS, trading assets, and trading liabilities that are classified as level 1 are valued based on quoted market
prices. For those instruments classified as level 2 or 3, refer to the respective valuation discussions within this footnote.
(c) LHFS are generally valued based on observable current market prices or, if quoted market prices are not available,
on quoted market prices of similar instruments. Refer to the LHFS section within this footnote for further discussion
of the LHFS carried at fair value. In instances when significant valuation assumptions are not readily observable in