SunTrust 2012 Annual Report Download - page 162
Download and view the complete annual report
Please find page 162 of the 2012 SunTrust annual report below. You can navigate through the pages in the report by either clicking on the pages listed below, or by using the keyword search tool below to find specific information within the annual report.-
 1
1 -
2
-
3
-
4
-
5
-
6
-
7
-
8
-
9
-
10
-
11
-
12
-
13
-
14
-
15
-
16
-
17
-
18
-
19
-
20
-
21
-
22
-
23
-
24
-
25
-
26
-
27
-
28
-
29
-
30
-
31
-
32
-
33
-
34
-
35
-
36
-
37
-
38
-
39
-
40
-
41
-
42
-
43
-
44
-
45
-
46
-
47
-
48
-
49
-
50
-
51
-
52
-
53
-
54
-
55
-
56
-
57
-
58
-
59
-
60
-
61
-
62
-
63
-
64
-
65
-
66
-
67
-
68
-
69
-
70
-
71
-
72
-
73
-
74
-
75
-
76
-
77
-
78
-
79
-
80
-
81
-
82
-
83
-
84
-
85
-
86
-
87
-
88
-
89
-
90
-
91
-
92
-
93
-
94
-
95
-
96
-
97
-
98
-
99
-
100
-
101
-
102
-
103
-
104
-
105
-
106
-
107
-
108
-
109
-
110
-
111
-
112
-
113
-
114
-
115
-
116
-
117
-
118
-
119
-
120
-
121
-
122
-
123
-
124
-
125
-
126
-
127
-
128
-
129
-
130
-
131
-
132
-
133
-
134
-
135
-
136
-
137
-
138
-
139
-
140
-
141
-
142
-
143
-
144
-
145
-
146
-
147
-
148
-
149
-
150
-
151
-
 152
152 -
 153
153 -
 154
154 -
 155
155 -
 156
156 -
 157
157 -
 158
158 -
 159
159 -
 160
160 -
 161
161 -
 162
162 -
 163
163 -
 164
164 -
 165
165 -
 166
166 -
 167
167 -
 168
168 -
 169
169 -
 170
170 -
 171
171 -
 172
172 -
173
-
174
-
175
-
176
-
177
-
178
-
179
-
180
-
181
-
182
-
183
-
184
-
185
-
186
-
187
-
188
-
189
-
190
-
191
-
192
-
193
-
194
-
195
-
196
-
197
-
198
-
199
-
200
-
201
-
202
-
203
-
204
-
205
-
206
-
207
-
208
-
209
-
210
-
211
-
212
-
213
-
214
-
215
-
216
-
217
-
218
-
219
-
220
-
221
-
222
-
223
-
224
-
225
-
226
-
227
-
228
 |
 |

Notes to Consolidated Financial Statements (Continued)
146
stock option exercise and employee termination. Through the repurchase of preferred stock issued to the U.S. Treasury in the first
quarter of 2011, the expected dividend yield was based on the current rate in effect at the grant date. Beginning in second quarter
2011, the Company began using the projected dividend to be paid as the dividend yield assumption. The risk-free interest rate is
derived from the U.S. Treasury yield curve in effect at the time of grant based on the expected life of the option.
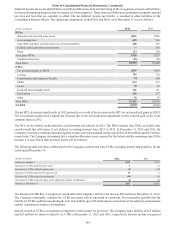
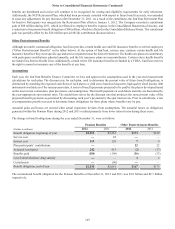
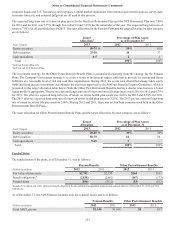
The weighted average fair values of options granted during 2012, 2011, and 2010 were $7.83, $10.51 and $12.78 per share,
respectively. The fair value of each option grant is estimated on the date of grant using the Black-Scholes option pricing model
based on the following assumptions:
Year Ended December 31
2012 2011 2010
Dividend yield 0.91% 0.75% 0.17%
Expected stock price volatility 39.88 34.87 56.09
Risk-free interest rate (weighted average) 1.07 2.48 2.80
Expected life of options 6 years 6 years 6 years
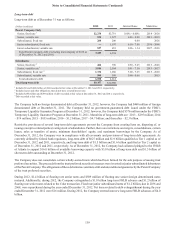
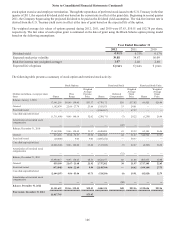
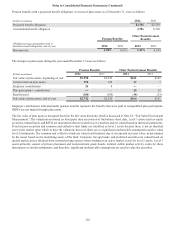
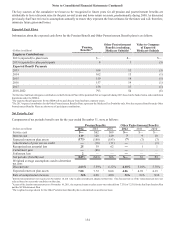
The following table presents a summary of stock option and restricted stock activity:
Stock Options Restricted Stock Restricted Stock Units
(Dollars in millions, except per share
data) Shares
Price
Range
Weighted
Average
Exercise
Price Shares
Deferred
Compensation
Weighted
Average
Grant
Price Shares
Weighted
Average
Grant
Price
Balance, January 1, 2010
17,661,216 $9.06 - 150.45 $53.17 4,770,172 $59 $37.02 66,420 $26.96
Granted 1,192,974 22.69 - 27.79 23.64 1,355,075 33 24.01 — —
Exercised/vested — — — (1,266,267) — 67.27 — —
Cancelled/expired/forfeited
(1,711,690) 9.06 - 140.14 52.62 (238,171) (7) 29.22 (1,230) 26.96
Amortization of restricted stock
compensation
— — — — (42) — — —
Balance, December 31, 2010
17,142,500 9.06 - 150.45 51.17 4,620,809 43 25.32 65,190 26.96
Granted 813,265 19.98 - 32.27 29.70 1,400,305 44 31.27 344,590 37.57
Exercised/vested (20,000) 9.06 9.06 (1,085,252) — 50.37 — —
Cancelled/expired/forfeited
(2,066,348) 9.06 - 140.40 63.40 (313,695) (7) 22.07 (4,305) 26.96
Amortization of restricted stock
compensation
— — — — (32) — — —
Balance, December 31, 2011
15,869,417 9.06 - 150.45 48.53 4,622,167 48 21.46 405,475 35.98
Granted 859,390 21.67 - 23.68 21.92 1,737,202 38 21.97 1,717,148 22.65
Exercised/vested (973,048) 9.06 - 22.69 9.90 (2,148,764) — 14.62 (109,149) 27.73
Cancelled/expired/forfeited (2,444,107) 9.06 - 85.06 45.73 (524,284) (8) 19.91 (82,828) 22.79
Amortization of restricted stock
compensation — — — — (30) — — —
Balance, December 31, 2012 13,311,652 $9.06 - 150.45 $50.15 3,686,321 $48 $25.56 1,930,646 $25.16
Exercisable, December 31, 2012 11,017,763 $55.45