SunTrust 2012 Annual Report Download - page 70
Download and view the complete annual report
Please find page 70 of the 2012 SunTrust annual report below. You can navigate through the pages in the report by either clicking on the pages listed below, or by using the keyword search tool below to find specific information within the annual report.-
 1
1 -
2
-
3
-
4
-
5
-
6
-
7
-
8
-
9
-
10
-
11
-
12
-
13
-
14
-
15
-
16
-
17
-
18
-
19
-
20
-
21
-
22
-
23
-
24
-
25
-
26
-
27
-
28
-
29
-
30
-
31
-
32
-
33
-
34
-
35
-
36
-
37
-
38
-
39
-
40
-
41
-
42
-
43
-
44
-
45
-
46
-
47
-
48
-
49
-
50
-
51
-
52
-
53
-
54
-
55
-
56
-
57
-
58
-
59
-
 60
60 -
 61
61 -
 62
62 -
 63
63 -
 64
64 -
 65
65 -
 66
66 -
 67
67 -
 68
68 -
 69
69 -
 70
70 -
 71
71 -
 72
72 -
 73
73 -
 74
74 -
 75
75 -
 76
76 -
 77
77 -
 78
78 -
 79
79 -
 80
80 -
81
-
82
-
83
-
84
-
85
-
86
-
87
-
88
-
89
-
90
-
91
-
92
-
93
-
94
-
95
-
96
-
97
-
98
-
99
-
100
-
101
-
102
-
103
-
104
-
105
-
106
-
107
-
108
-
109
-
110
-
111
-
112
-
113
-
114
-
115
-
116
-
117
-
118
-
119
-
120
-
121
-
122
-
123
-
124
-
125
-
126
-
127
-
128
-
129
-
130
-
131
-
132
-
133
-
134
-
135
-
136
-
137
-
138
-
139
-
140
-
141
-
142
-
143
-
144
-
145
-
146
-
147
-
148
-
149
-
150
-
151
-
152
-
153
-
154
-
155
-
156
-
157
-
158
-
159
-
160
-
161
-
162
-
163
-
164
-
165
-
166
-
167
-
168
-
169
-
170
-
171
-
172
-
173
-
174
-
175
-
176
-
177
-
178
-
179
-
180
-
181
-
182
-
183
-
184
-
185
-
186
-
187
-
188
-
189
-
190
-
191
-
192
-
193
-
194
-
195
-
196
-
197
-
198
-
199
-
200
-
201
-
202
-
203
-
204
-
205
-
206
-
207
-
208
-
209
-
210
-
211
-
212
-
213
-
214
-
215
-
216
-
217
-
218
-
219
-
220
-
221
-
222
-
223
-
224
-
225
-
226
-
227
-
228
 |
 |
54
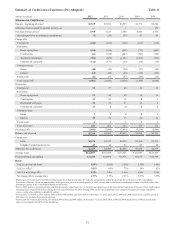
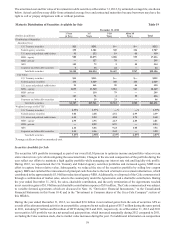
Nonaccrual loans, loans over 90 days past due and still accruing, and TDR loans, are problem loans or loans with potential
weaknesses that are disclosed in the nonperforming assets table above. Loans with known potential credit problems that may
not otherwise be disclosed in this table include accruing criticized commercial loans, which are disclosed along with additional
credit quality information in Note 6, “Loans,” to the Consolidated Financial Statements in this Form 10-K. At December 31,
2012 and December 31, 2011, there were no known significant potential problem loans that are not otherwise disclosed.
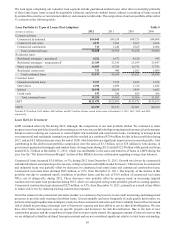
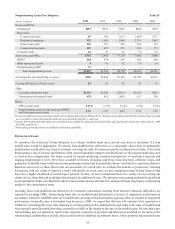
Nonperforming Loans
Nonperforming residential loans were the largest driver of the overall decline in NPLs, decreasing $722 million, down 37%,
during 2012. The reduction in nonguaranteed residential mortgage NPLs accounted for $617 million of this decline, primarily
due to the sale of $486 million of residential mortgage NPLs, net of $193 million in charge-offs, during 2012. Residential
construction NPLs decreased $108 million, mainly attributable to net charge-offs and lower inflows.
The decrease of $632 million, or 68%, in nonperforming commercial loans also contributed to the decline in NPLs during
2012. Specifically, the reduction in nonperforming commercial loans was predominantly driven by a $222 million reduction
in commercial real estate NPLs, which included the sale of $161 million of commercial real estate NPLs, net of $32 million
in charge-offs, and a $256 million reduction in commercial construction NPLs. As we move through the current commercial
real estate market conditions, we continue to expect some variability in inflows of commercial real estate NPLs.
Interest income on consumer and residential nonaccrual loans, if recognized, is recognized on a cash basis. Interest income
on commercial nonaccrual loans is not typically recognized until after the principal has been reduced to zero. We recognized
$31 million and $34 million of interest income related to nonaccrual loans during 2012 and 2011, respectively. If all such
loans had been accruing interest according to their original contractual terms, estimated interest income of $147 million and
$246 million during 2012 and 2011, respectively, would have been recognized.
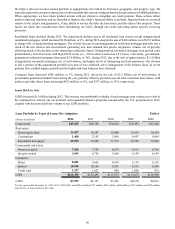
Other Nonperforming Assets
OREO decreased $215 million, or 45%, during 2012. The decline consisted of net decreases of $115 million in residential
construction related properties, $68 million in residential homes, and $32 million in commercial properties. During 2012 and
2011, sales of OREO resulted in proceeds of $493 million and $619 million, respectively, contributing to net gains on sales
of OREO of $34 million and a net loss of $4 million, respectively, inclusive of valuation reserves, primarily related to lots
and land evaluated under the pooled approach. Sales of OREO and the related gains or losses are highly dependent on our
disposition strategy and buyer opportunities. See Note 18, “Fair Value Election and Measurement,” to the Consolidated
Financial Statements in this Form 10-K for more information. Gains and losses on the sale of OREO are recorded in other
real estate expense in the Consolidated Statements of Income. Geographically, most of our OREO properties are located in
Georgia, Florida, and North Carolina. Residential properties and land comprised 46% and 29%, respectively, of OREO at
December 31, 2012; the remainder is related to commercial and other properties. Upon foreclosure, the values of these
properties were reevaluated and, if necessary, written down to their then-current estimated value less estimated costs to sell.
Any further declines in home prices could result in additional losses on these properties. We are actively managing and
disposing of these foreclosed assets to minimize future losses.
At December 31, 2012 and 2011, total accruing loans past due ninety days or more included LHFI and LHFS and totaled $0.8
billion and $2.0 billion, respectively. Accruing LHFI past due ninety days or more decreased by $1.2 billion, or 61%, during
2012. The changes were primarily driven by the sale of certain government-guaranteed residential mortgages and student
loans as part of our disposition actions primarily in the second half of 2012. The majority of our past due accruing loans are
residential mortgages and student loans that are fully guaranteed by a federal agency, which comprised 92% and 97% of past
due accruing loans at December 31, 2012 and 2011, respectively. As of the same dates, $60 million and $57 million, respectively,
of accruing loans past due ninety days or more were not guaranteed.
In April 2011, we, along with other servicers, entered into Consent Orders with supervisory regulatory agencies (in our case,
the FRB). We describe the Consent Order in Note 19, “Contingencies,” to the Consolidated Financial Statements in this Form
10-K and a copy of it was filed as Exhibit 10.25 to the Company's Annual Report on Form 10-K for the year ended December 31,
2011. The Consent Order required us to improve certain processes related to residential mortgage loan servicing. Under the
Consent Order, we agreed to retain an independent consultant approved by the FRB to conduct a review of residential
foreclosure actions pending or completed at any time during 2009 and 2010 for loans serviced by STM to identify any errors
or deficiencies, determine whether any instances so identified resulted in financial harm, and prepare a written report detailing
the findings. On January 7, 2013, we, along with nine other mortgage servicers, entered into a Acceleration and Remediation
Agreement related to the Consent Order with the FRB to conclude the independent foreclosure review and accelerate
remediation to all borrowers whose loans were included in the review. See additional discussion in the "Executive Overview"
and "Noninterest Expense" sections of this MD&A.