SunTrust 2012 Annual Report Download - page 101
Download and view the complete annual report
Please find page 101 of the 2012 SunTrust annual report below. You can navigate through the pages in the report by either clicking on the pages listed below, or by using the keyword search tool below to find specific information within the annual report.-
 1
1 -
2
-
3
-
4
-
5
-
6
-
7
-
8
-
9
-
10
-
11
-
12
-
13
-
14
-
15
-
16
-
17
-
18
-
19
-
20
-
21
-
22
-
23
-
24
-
25
-
26
-
27
-
28
-
29
-
30
-
31
-
32
-
33
-
34
-
35
-
36
-
37
-
38
-
39
-
40
-
41
-
42
-
43
-
44
-
45
-
46
-
47
-
48
-
49
-
50
-
51
-
52
-
53
-
54
-
55
-
56
-
57
-
58
-
59
-
60
-
61
-
62
-
63
-
64
-
65
-
66
-
67
-
68
-
69
-
70
-
71
-
72
-
73
-
74
-
75
-
76
-
77
-
78
-
79
-
80
-
81
-
82
-
83
-
84
-
85
-
86
-
87
-
88
-
89
-
90
-
 91
91 -
 92
92 -
 93
93 -
 94
94 -
 95
95 -
 96
96 -
 97
97 -
 98
98 -
 99
99 -
 100
100 -
 101
101 -
 102
102 -
 103
103 -
 104
104 -
 105
105 -
 106
106 -
 107
107 -
 108
108 -
 109
109 -
 110
110 -
 111
111 -
112
-
113
-
114
-
115
-
116
-
117
-
118
-
119
-
120
-
121
-
122
-
123
-
124
-
125
-
126
-
127
-
128
-
129
-
130
-
131
-
132
-
133
-
134
-
135
-
136
-
137
-
138
-
139
-
140
-
141
-
142
-
143
-
144
-
145
-
146
-
147
-
148
-
149
-
150
-
151
-
152
-
153
-
154
-
155
-
156
-
157
-
158
-
159
-
160
-
161
-
162
-
163
-
164
-
165
-
166
-
167
-
168
-
169
-
170
-
171
-
172
-
173
-
174
-
175
-
176
-
177
-
178
-
179
-
180
-
181
-
182
-
183
-
184
-
185
-
186
-
187
-
188
-
189
-
190
-
191
-
192
-
193
-
194
-
195
-
196
-
197
-
198
-
199
-
200
-
201
-
202
-
203
-
204
-
205
-
206
-
207
-
208
-
209
-
210
-
211
-
212
-
213
-
214
-
215
-
216
-
217
-
218
-
219
-
220
-
221
-
222
-
223
-
224
-
225
-
226
-
227
-
228
 |
 |

85
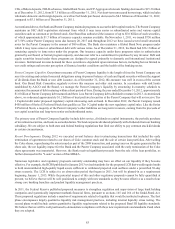
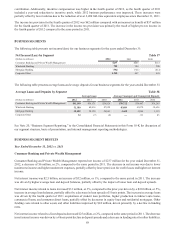
MSRs of $69 million and $161 million (including decay of $241 million and $200 million), respectively, inclusive of the
mark-to-market adjustments on the related hedges.
We also have market risk from capital stock we hold in the FHLB of Atlanta and from capital stock we hold in the Federal
Reserve Bank. In order to be an FHLB member, we are required to purchase capital stock in the FHLB. In exchange, members
take advantage of competitively priced advances as a wholesale funding source and access grants and low-cost loans for
affordable housing and community-development projects, amongst other benefits. As of December 31, 2012, we held a total
of $229 million of capital stock in the FHLB, a decrease of $113 million compared to December 31, 2011. In order to become
a member of the Federal Reserve System, regulations require that we hold a certain amount of capital stock as either a
percentage of the Bank’s capital or as a percentage of total deposit liabilities. As of December 31, 2012, we held $402 million
of Federal Reserve Bank stock, which is relatively unchanged from December 31, 2011.
We also hold, as of December 31, 2012, a total net book value of approximately $32 million of private equity (direct investments)
and other equity-related investments. We generally hold these investments as long-term investments. If conditions in the
market deteriorate, impairment charges could occur related to these long-term investments and other assets, including but not
limited to goodwill and other intangible assets.
We continue to monitor our holdings of foreign debt, securities, and commitments to lend to foreign countries and corporations,
both funded and unfunded. Specifically, the risk is higher for exposure to countries that are experiencing significant economic,
fiscal, and/or political strains. At December 31, 2012, we identified five countries in Europe that we believe are experiencing
strains such that the likelihood of default is higher than would be anticipated if current economic, fiscal, and political strains
were not present. The countries we identified were Greece, Ireland, Italy, Portugal, and Spain, and were chosen based on the
economic situation experienced in these countries during 2012 and 2011, and continuing to exist as of December 31, 2012.
At December 31, 2012, we had no direct exposure to sovereign debt of these countries. However, at December 31, 2012, we
had direct exposure to corporations and individuals in these countries of $109 million that was comprised of unfunded
commitments to lend, funded loans, and a nominal amount of letters of credit. Indirect exposure to these countries was $39
million at December 31, 2012 and consisted primarily of double default risk exposure. The majority of the exposure is the
notional amount of letters of credit issued on behalf of our role as an agent bank under the terms of a syndicated corporate
loan agreement, wherein other participant banks in the syndicate are located in the identified higher risk countries. Overall,
gross exposure to these countries continues to be less than 1% of our total assets as of December 31, 2012, consistent with
our exposure at December 31, 2011.
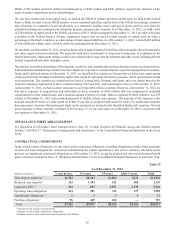
OFF-BALANCE SHEET ARRANGEMENTS
See discussion of off-balance sheet arrangements in Note 10, “Certain Transfers of Financial Assets and Variable Interest
Entities,” and Note 17, “Reinsurance Arrangements and Guarantees,” to the Consolidated Financial Statements in this Form
10-K.
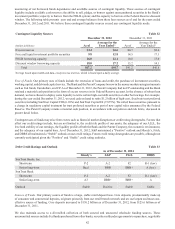
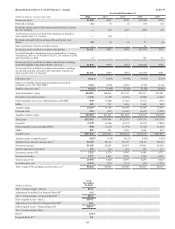
CONTRACTUAL COMMITMENTS
In the normal course of business, we enter into certain contractual obligations, including obligations to make future payments
on debt and lease arrangements, contractual commitments for capital expenditures, and service contracts. The table below
presents our significant contractual obligations as of December 31, 2012, except for pension and other postretirement benefit
plans, which are included in Note 15, "Employee Benefit Plans," to the Consolidated Financial Statements in this Form 10-K.
Table 35
As of December 31, 2012
(Dollars in millions) 1 year or less 1-3 years 3-5 years After 5 years Total
Time deposit maturities 1$6,743 $6,143 $1,804 $232 $14,922
Brokered time deposits 1163 1,184 121 668 2,136
Long-term debt 1,2 294 851 5,871 2,330 9,346
Operating lease obligations 214 387 331 377 1,309
Capital lease obligations 11 3 3 4 11
Purchase obligations 396 469 222 — 787
Total $7,511 $9,037 $8,352 $3,611 $28,511
1Amounts do not include accrued interest.
2Amounts do not include capital lease obligations.
3Includes contracts with a minimum annual payment of $5 million.