SunTrust 2012 Annual Report Download - page 46
Download and view the complete annual report
Please find page 46 of the 2012 SunTrust annual report below. You can navigate through the pages in the report by either clicking on the pages listed below, or by using the keyword search tool below to find specific information within the annual report.-
 1
1 -
2
-
3
-
4
-
5
-
6
-
7
-
8
-
9
-
10
-
11
-
12
-
13
-
14
-
15
-
16
-
17
-
18
-
19
-
20
-
21
-
22
-
23
-
24
-
25
-
26
-
27
-
28
-
29
-
30
-
31
-
32
-
33
-
34
-
35
-
 36
36 -
 37
37 -
 38
38 -
 39
39 -
 40
40 -
 41
41 -
 42
42 -
 43
43 -
 44
44 -
 45
45 -
 46
46 -
 47
47 -
 48
48 -
 49
49 -
 50
50 -
 51
51 -
 52
52 -
 53
53 -
 54
54 -
 55
55 -
 56
56 -
57
-
58
-
59
-
60
-
61
-
62
-
63
-
64
-
65
-
66
-
67
-
68
-
69
-
70
-
71
-
72
-
73
-
74
-
75
-
76
-
77
-
78
-
79
-
80
-
81
-
82
-
83
-
84
-
85
-
86
-
87
-
88
-
89
-
90
-
91
-
92
-
93
-
94
-
95
-
96
-
97
-
98
-
99
-
100
-
101
-
102
-
103
-
104
-
105
-
106
-
107
-
108
-
109
-
110
-
111
-
112
-
113
-
114
-
115
-
116
-
117
-
118
-
119
-
120
-
121
-
122
-
123
-
124
-
125
-
126
-
127
-
128
-
129
-
130
-
131
-
132
-
133
-
134
-
135
-
136
-
137
-
138
-
139
-
140
-
141
-
142
-
143
-
144
-
145
-
146
-
147
-
148
-
149
-
150
-
151
-
152
-
153
-
154
-
155
-
156
-
157
-
158
-
159
-
160
-
161
-
162
-
163
-
164
-
165
-
166
-
167
-
168
-
169
-
170
-
171
-
172
-
173
-
174
-
175
-
176
-
177
-
178
-
179
-
180
-
181
-
182
-
183
-
184
-
185
-
186
-
187
-
188
-
189
-
190
-
191
-
192
-
193
-
194
-
195
-
196
-
197
-
198
-
199
-
200
-
201
-
202
-
203
-
204
-
205
-
206
-
207
-
208
-
209
-
210
-
211
-
212
-
213
-
214
-
215
-
216
-
217
-
218
-
219
-
220
-
221
-
222
-
223
-
224
-
225
-
226
-
227
-
228
 |
 |

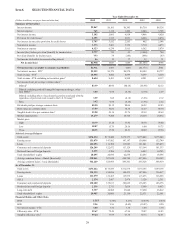
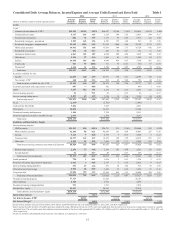
30
Total average shareholders’ equity to total average assets 11.64 12.00 13.25 12.70 10.58
Tangible equity to tangible assets28.82 8.10 10.12 9.66 8.46
Effective tax rate (benefit) 28.29 10.84 NM 5(36.50) (9.23)
Allowance to year-end total loans 1.80 2.01 2.58 2.76 1.86
Total nonperforming assets to total loans plus OREO, other
repossessed assets, and nonperforming LHFS 1.52 2.76 4.08 5.33 3.49
Common dividend payout ratio65.6 12.9 N/A N/A 135.6
Capital Adequacy
Tier 1 common equity 10.04% 9.22% 8.08% 7.67 % 5.83%
Tier 1 capital 11.13 10.90 13.67 12.96 10.87
Total capital 13.48 13.67 16.54 16.43 14.04
Tier 1 leverage 8.91 8.75 10.94 10.90 10.45
1 Beginning in the fourth quarter of 2009, SunTrust began recording the provision for unfunded commitments within the provision for credit losses in the
Consolidated Statements of Income. Considering the immateriality of this provision, prior to the fourth quarter of 2009, the provision for unfunded
commitments remains classified within other noninterest expense in the Consolidated Statements of Income.
2 See Non-GAAP reconcilements in Table 39 of the MD&A.
3 2008 amounts have been recalculated in accordance with updated accounting guidance related to EPS, that was effective January 1, 2009, and required
retrospective application.
4 For EPS calculation purposes, the impact of dilutive securities are excluded from the diluted share count during periods in which we recognize a net loss
available to common shareholders because the impact would be antidultive.
5 Not meaningful.
6 The common dividend payout ratio is not applicable in a period of net loss.
Item 7. MANAGEMENT’S DISCUSSION AND ANALYSIS OF FINANCIAL CONDITION AND
RESULTS OF OPERATIONS
Important Cautionary Statement About Forward-Looking Statements
This report contains forward-looking statements. Statements regarding (i) future levels of net interest margin, net interest income,
our efficiency ratio, mortgage repurchase demands and the mortgage repurchase reserve and related provision expense, interchange
revenue, consulting and legal expenses, other real estate expense, net charge-offs and the trend in net charge-offs, risk-weighted
assets, and capital ratios; (ii) our expectations regarding the adequacy or sufficiency of the ALLL, including increases in the ALLL
related to the termination of the internal foreclosure review, the Consent Order, or to cover the estimated losses on loans sold to
GSEs prior to 2009; (iii) the timing and impact of planned future asset sales, including sales of student loans, Ginnie Mae securities,
non-performing residential and commercial loans, and affordable housing investments; (iv) the favorability of overall conditions
in the mortgage market; (v) our expectations regarding our ability to mitigate the impact of card fees lost as a result of regulatory
changes, and the timing of such actions; and (vi) our expectation that we will be able to fully use our DTAs; are forward looking
statements. Also, any statement that does not describe historical or current facts is a forward-looking statement. These statements
often include the words “believes,” “expects,” “anticipates,” “estimates,” “intends,” “plans,” “targets,” “initiatives,” “potentially,”
“probably,” “projects,” “outlook” or similar expressions or future conditional verbs such as “may,” “will,” “should,” “would,”
and “could.” Such statements are based upon the current beliefs and expectations of management and on information currently
available to management. Such statements speak as of the date hereof, and we do not assume any obligation to update the statements
made herein or to update the reasons why actual results could differ from those contained in such statements in light of new
information or future events.
Forward-looking statements are subject to significant risks and uncertainties. Investors are cautioned against placing undue reliance
on such statements. Actual results may differ materially from those set forth in the forward-looking statements. Factors that could
cause actual results to differ materially from those described in the forward-looking statements can be found in Part I, "Item 1A.
Risk Factors" in this report and include risks discussed in this MD&A and in other periodic reports that we file with the SEC.
Those factors include: our framework for managing risks may not be effective in mitigating risk and loss to us; as one of the
largest lenders in the Southeast and Mid-Atlantic U.S. and a provider of financial products and services to consumers and businesses
across the U.S., our financial results have been, and may continue to be, materially affected by general economic conditions,
particularly unemployment levels and home prices in the U.S., and a deterioration of economic conditions or of the financial
markets may materially adversely affect our lending and other businesses and our financial results and condition; legislation and
regulation, including the Dodd-Frank Act, as well as future legislation and/or regulation, could require us to change certain of our
business practices, reduce our revenue, impose additional costs on us, or otherwise adversely affect our business operations and/
or competitive position; we are subject to capital adequacy and liquidity guidelines and, if we fail to meet these guidelines, our
financial condition would be adversely affected; loss of customer deposits and market illiquidity could increase our funding costs;
we rely on the mortgage secondary market and GSEs for some of our liquidity; we are subject to credit risk; our ALLL may not
be adequate to cover our eventual losses; we may have more credit risk and higher credit losses to the extent our loans are
concentrated by loan type, industry segment, borrower type, or location of the borrower or collateral; we will realize future losses