SunTrust 2012 Annual Report Download - page 136
Download and view the complete annual report
Please find page 136 of the 2012 SunTrust annual report below. You can navigate through the pages in the report by either clicking on the pages listed below, or by using the keyword search tool below to find specific information within the annual report.-
 1
1 -
2
-
3
-
4
-
5
-
6
-
7
-
8
-
9
-
10
-
11
-
12
-
13
-
14
-
15
-
16
-
17
-
18
-
19
-
20
-
21
-
22
-
23
-
24
-
25
-
26
-
27
-
28
-
29
-
30
-
31
-
32
-
33
-
34
-
35
-
36
-
37
-
38
-
39
-
40
-
41
-
42
-
43
-
44
-
45
-
46
-
47
-
48
-
49
-
50
-
51
-
52
-
53
-
54
-
55
-
56
-
57
-
58
-
59
-
60
-
61
-
62
-
63
-
64
-
65
-
66
-
67
-
68
-
69
-
70
-
71
-
72
-
73
-
74
-
75
-
76
-
77
-
78
-
79
-
80
-
81
-
82
-
83
-
84
-
85
-
86
-
87
-
88
-
89
-
90
-
91
-
92
-
93
-
94
-
95
-
96
-
97
-
98
-
99
-
100
-
101
-
102
-
103
-
104
-
105
-
106
-
107
-
108
-
109
-
110
-
111
-
112
-
113
-
114
-
115
-
116
-
117
-
118
-
119
-
120
-
121
-
122
-
123
-
124
-
125
-
 126
126 -
 127
127 -
 128
128 -
 129
129 -
 130
130 -
 131
131 -
 132
132 -
 133
133 -
 134
134 -
 135
135 -
 136
136 -
 137
137 -
 138
138 -
 139
139 -
 140
140 -
 141
141 -
 142
142 -
 143
143 -
 144
144 -
 145
145 -
 146
146 -
147
-
148
-
149
-
150
-
151
-
152
-
153
-
154
-
155
-
156
-
157
-
158
-
159
-
160
-
161
-
162
-
163
-
164
-
165
-
166
-
167
-
168
-
169
-
170
-
171
-
172
-
173
-
174
-
175
-
176
-
177
-
178
-
179
-
180
-
181
-
182
-
183
-
184
-
185
-
186
-
187
-
188
-
189
-
190
-
191
-
192
-
193
-
194
-
195
-
196
-
197
-
198
-
199
-
200
-
201
-
202
-
203
-
204
-
205
-
206
-
207
-
208
-
209
-
210
-
211
-
212
-
213
-
214
-
215
-
216
-
217
-
218
-
219
-
220
-
221
-
222
-
223
-
224
-
225
-
226
-
227
-
228
 |
 |

Notes to Consolidated Financial Statements (Continued)
120
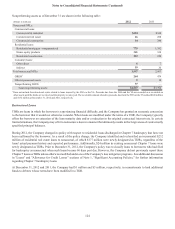
Risk ratings are refreshed at least annually, or more frequently as appropriate, based upon considerations such as market conditions,
loan characteristics, and portfolio trends. Additionally, management routinely reviews portfolio risk ratings, trends, and
concentrations to support risk identification and mitigation activities.
For consumer and residential loans, the Company monitors credit risk based on indicators such as delinquencies and FICO scores.
The Company believes that consumer credit risk, as assessed by the industry-wide FICO scoring method, is a relevant credit quality
indicator. Borrower-specific FICO scores are obtained at origination as part of the Company’ s formal underwriting process, and
refreshed FICO scores are obtained by the Company at least quarterly. In response to updates in the industry-wide FICO scoring
model and to enhance the Company's ability to manage credit risk, the Company updated its FICO scoring model to an updated
version for the Home Equity, Indirect, and Other Direct portfolios in 2012. This change was the primary reason for the changes
in the percentage of balances across the FICO score ranges noted below. There was no impact to the Company's financial position
or results of operations as a result of updating the FICO scoring model.
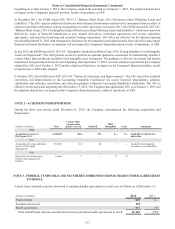
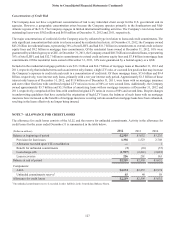
For government-guaranteed student loans, the Company monitors the credit quality based primarily on delinquency status, as it
is a more relevant indicator of credit quality due to the government guarantee. At December 31, 2012 and 2011, 89% and 79%,
respectively, of the guaranteed student loan portfolio was current with respect to payments. Loss exposure to the Company on
these loans is mitigated by the government guarantee.
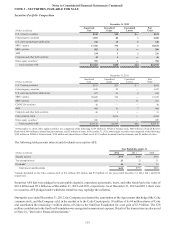
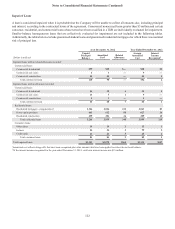
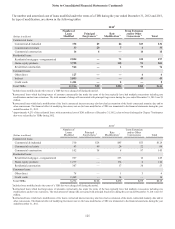
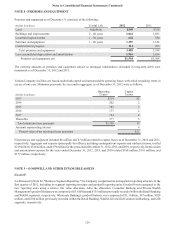
LHFI by credit quality indicator are shown in the tables below:
Commercial Loans
Commercial & industrial Commercial real estate Commercial construction
(Dollars in millions) December 31,
2012 December 31,
2011 December 31,
2012 December 31,
2011 December 31,
2012 December 31,
2011
Credit rating:
Pass $52,292 $47,683 $3,564 $3,845 $506 $581
Criticized accruing 1,562 1,507 497 961 173 369
Criticized nonaccruing 194 348 66 288 34 290
Total $54,048 $49,538 $4,127 $5,094 $713 $1,240
Residential Loans 1
Residential mortgages -
nonguaranteed Home equity products Residential construction
(Dollars in millions) December 31,
2012 December 31,
2011 December 31,
2012 December 31,
2011 December 31,
2012 December 31,
2011
Current FICO score range:
700 and above $17,410 $16,139 $11,339 $11,084 $561 $661
620 - 699 3,850 4,132 2,297 2,903 123 202
Below 62022,129 2,972 1,169 1,778 69 117
Total $23,389 $23,243 $14,805 $15,765 $753 $980
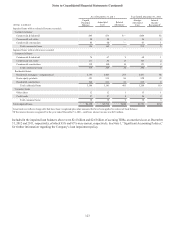
Consumer Loans 3
Other direct Indirect Credit cards
(Dollars in millions) December 31,
2012 December 31,
2011 December 31,
2012 December 31,
2011 December 31,
2012 December 31,
2011
Current FICO score range:
700 and above $1,980 $1,614 $8,300 $7,397 $435 $347
620 - 699 350 359 2,038 1,990 152 142
Below 620266 86 660 778 45 51
Total $2,396 $2,059 $10,998 $10,165 $632 $540
1Excludes $4.3 billion and $6.7 billion at December 31, 2012 and 2011, respectively, of guaranteed residential loans. At both December 31, 2012 and 2011, the
majority of these loans had FICO scores of 700 and above.
2For substantially all loans with refreshed FICO scores below 620, the borrower’s FICO score at the time of origination exceeded 620 but has since deteriorated
as the loan has seasoned.
3Excludes $5.4 billion and $7.2 billion at December 31, 2012 and 2011, respectively, of guaranteed student loans.