SunTrust 2012 Annual Report Download - page 178
Download and view the complete annual report
Please find page 178 of the 2012 SunTrust annual report below. You can navigate through the pages in the report by either clicking on the pages listed below, or by using the keyword search tool below to find specific information within the annual report.-
 1
1 -
2
-
3
-
4
-
5
-
6
-
7
-
8
-
9
-
10
-
11
-
12
-
13
-
14
-
15
-
16
-
17
-
18
-
19
-
20
-
21
-
22
-
23
-
24
-
25
-
26
-
27
-
28
-
29
-
30
-
31
-
32
-
33
-
34
-
35
-
36
-
37
-
38
-
39
-
40
-
41
-
42
-
43
-
44
-
45
-
46
-
47
-
48
-
49
-
50
-
51
-
52
-
53
-
54
-
55
-
56
-
57
-
58
-
59
-
60
-
61
-
62
-
63
-
64
-
65
-
66
-
67
-
68
-
69
-
70
-
71
-
72
-
73
-
74
-
75
-
76
-
77
-
78
-
79
-
80
-
81
-
82
-
83
-
84
-
85
-
86
-
87
-
88
-
89
-
90
-
91
-
92
-
93
-
94
-
95
-
96
-
97
-
98
-
99
-
100
-
101
-
102
-
103
-
104
-
105
-
106
-
107
-
108
-
109
-
110
-
111
-
112
-
113
-
114
-
115
-
116
-
117
-
118
-
119
-
120
-
121
-
122
-
123
-
124
-
125
-
126
-
127
-
128
-
129
-
130
-
131
-
132
-
133
-
134
-
135
-
136
-
137
-
138
-
139
-
140
-
141
-
142
-
143
-
144
-
145
-
146
-
147
-
148
-
149
-
150
-
151
-
152
-
153
-
154
-
155
-
156
-
157
-
158
-
159
-
160
-
161
-
162
-
163
-
164
-
165
-
166
-
167
-
 168
168 -
 169
169 -
 170
170 -
 171
171 -
 172
172 -
 173
173 -
 174
174 -
 175
175 -
 176
176 -
 177
177 -
 178
178 -
 179
179 -
 180
180 -
 181
181 -
 182
182 -
 183
183 -
 184
184 -
 185
185 -
 186
186 -
 187
187 -
 188
188 -
189
-
190
-
191
-
192
-
193
-
194
-
195
-
196
-
197
-
198
-
199
-
200
-
201
-
202
-
203
-
204
-
205
-
206
-
207
-
208
-
209
-
210
-
211
-
212
-
213
-
214
-
215
-
216
-
217
-
218
-
219
-
220
-
221
-
222
-
223
-
224
-
225
-
226
-
227
-
228
 |
 |
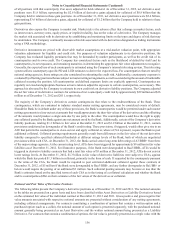
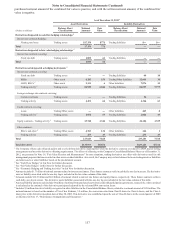
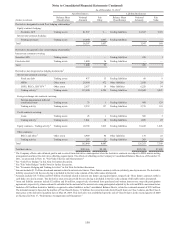
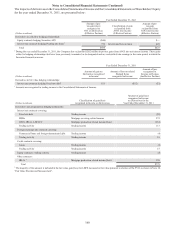
Notes to Consolidated Financial Statements (Continued)
162
making a non-recoverable payment on any written CDS. During 2012 and 2011, the only instances of default on written CDS
were driven by credit indices with constituent credit default. In all cases where the Company made resulting cash payments
to settle, the Company collected like amounts from the counterparties to the offsetting purchased CDS. At December 31, 2012
and 2011, the written CDS had remaining terms ranging from less than one year to three years. The maximum guarantees
outstanding at December 31, 2012 and 2011, as measured by the gross notional amounts of written CDS, were $52 million
and $167 million, respectively. At December 31, 2012 and 2011, the gross notional amounts of purchased CDS contracts,
which represent benefits to, rather than obligations of, the Company, were $175 million. The fair values of written CDS were
$1 million and $4 million at December 31, 2012 and 2011, respectively, and the fair values of purchased CDS were immaterial
and $6 million at December 31, 2012 and 2011, respectively.
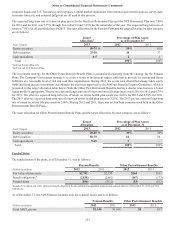
The Company has also entered into TRS contracts on loans. The Company’s TRS business consists of matched trades, such
that when the Company pays depreciation on one TRS, it receives the same amount on the matched TRS. As such, the Company
does not have any long or short exposure, other than credit risk of its counterparty which is mitigated through collateralization.
The Company typically receives initial cash collateral from the counterparty upon entering into the TRS and is entitled to
additional collateral if the fair value of the underlying reference assets deteriorates. At December 31, 2012 and 2011, there
were $1.9 billion and $1.6 billion of outstanding and offsetting TRS notional balances, respectively. The fair values of the
TRS derivative assets and liabilities at December 31, 2012, were $51 million and $46 million, respectively, and related collateral
held at December 31, 2012, was $282 million. The fair values of the TRS derivative assets and liabilities at December 31,
2011, were $20 million and $17 million, respectively, and related collateral held at December 31, 2011, was $285 million.
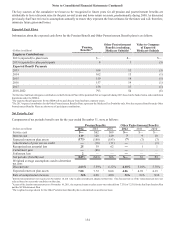
The Company writes risk participations, which are credit derivatives, whereby the Company has guaranteed payment to a
dealer counterparty in the event that the counterparty experiences a loss on a derivative, such as an interest rate swap, due to
a failure to pay by the counterparty’s customer (the “obligor”) on that derivative. The Company monitors its payment risk on
its risk participations by monitoring the creditworthiness of the obligors, which is based on the normal credit review process
the Company would have performed had it entered into the derivatives directly with the obligors. The obligors are all
corporations or partnerships. However, the Company continues to monitor the creditworthiness of its obligors and the likelihood
of payment could change at any time due to unforeseen circumstances. To date, no material losses have been incurred related
to the Company’s written risk participations. At December 31, 2012 and 2011, the remaining terms on these risk participations
generally ranged from one year to ten years with a weighted average on the maximum estimated exposure of 4.4 years. The
Company’s maximum estimated exposure to written risk participations, as measured by projecting a maximum value of the
guaranteed derivative instruments based on interest rate curve simulations and assuming 100% default by all obligors on the
maximum values, was approximately $20 million and $57 million at December 31, 2012 and 2011, respectively. The fair
values of the written risk participations were not material at both December 31, 2012 and 2011. As part of its trading activities,
the Company may enter into purchased risk participations to mitigate credit exposure to a derivative counterparty.
Cash Flow Hedges
The Company utilizes a comprehensive risk management strategy to monitor sensitivity of earnings to movements in interest
rates. Specific types of funding and principal amounts hedged are determined based on prevailing market conditions and the
shape of the yield curve. In conjunction with this strategy, the Company may employ various interest rate derivatives as risk
management tools to hedge interest rate risk from recognized assets and liabilities or from forecasted transactions. The terms
and notional amounts of derivatives are determined based on management’s assessment of future interest rates, as well as
other factors. At December 31, 2012, the Company’s outstanding interest rate hedging relationships include interest rate swaps
that have been designated as cash flow hedges of probable forecasted transactions related to recognized floating rate loans.
Interest rate swaps have been designated as hedging the exposure to the benchmark interest rate risk associated with floating
rate loans. At December 31, 2012 and 2011, the maximum range of hedge maturities for hedges of floating rate loans was less
than one year to five years, with the weighted average being 2.4 years and 3.4 years, respectively. Ineffectiveness on these
hedges was not material during the years ended December 31, 2012 and 2011. As of December 31, 2012, $398 million of the
deferred net gains on derivatives that are recognized in AOCI are expected to be reclassified to net interest income over the
next twelve months in connection with the recognition of interest income on these hedged items. The amount to be reclassified
into income includes both active and terminated or de-designated cash flow hedges. The Company may choose to terminate
or de-designate a hedging relationship in this program due to a change in the risk management objective for that specific hedge
item, which may arise in conjunction with an overall balance sheet management strategy.
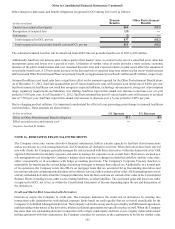
During 2008, the Company executed the Agreements on 60 million (shares are adjusted for Coke's two-for-one stock split,
which was effective August 10, 2012) common shares of Coke. A consolidated subsidiary of SunTrust owned 45.8 million
Coke common shares, and a consolidated subsidiary of the Bank owned 14.2 million Coke common shares. These two
subsidiaries entered into separate derivative contracts on their respective holdings of Coke common shares with the Coke
Counterparty. Execution of the Agreements (including the pledges of the Coke common shares pursuant to the terms of the
Agreements) did not constitute a sale of the Coke common shares under U.S. GAAP for several reasons, including that