SunTrust 2012 Annual Report Download - page 130
Download and view the complete annual report
Please find page 130 of the 2012 SunTrust annual report below. You can navigate through the pages in the report by either clicking on the pages listed below, or by using the keyword search tool below to find specific information within the annual report.-
 1
1 -
2
-
3
-
4
-
5
-
6
-
7
-
8
-
9
-
10
-
11
-
12
-
13
-
14
-
15
-
16
-
17
-
18
-
19
-
20
-
21
-
22
-
23
-
24
-
25
-
26
-
27
-
28
-
29
-
30
-
31
-
32
-
33
-
34
-
35
-
36
-
37
-
38
-
39
-
40
-
41
-
42
-
43
-
44
-
45
-
46
-
47
-
48
-
49
-
50
-
51
-
52
-
53
-
54
-
55
-
56
-
57
-
58
-
59
-
60
-
61
-
62
-
63
-
64
-
65
-
66
-
67
-
68
-
69
-
70
-
71
-
72
-
73
-
74
-
75
-
76
-
77
-
78
-
79
-
80
-
81
-
82
-
83
-
84
-
85
-
86
-
87
-
88
-
89
-
90
-
91
-
92
-
93
-
94
-
95
-
96
-
97
-
98
-
99
-
100
-
101
-
102
-
103
-
104
-
105
-
106
-
107
-
108
-
109
-
110
-
111
-
112
-
113
-
114
-
115
-
116
-
117
-
118
-
119
-
 120
120 -
 121
121 -
 122
122 -
 123
123 -
 124
124 -
 125
125 -
 126
126 -
 127
127 -
 128
128 -
 129
129 -
 130
130 -
 131
131 -
 132
132 -
 133
133 -
 134
134 -
 135
135 -
 136
136 -
 137
137 -
 138
138 -
 139
139 -
 140
140 -
141
-
142
-
143
-
144
-
145
-
146
-
147
-
148
-
149
-
150
-
151
-
152
-
153
-
154
-
155
-
156
-
157
-
158
-
159
-
160
-
161
-
162
-
163
-
164
-
165
-
166
-
167
-
168
-
169
-
170
-
171
-
172
-
173
-
174
-
175
-
176
-
177
-
178
-
179
-
180
-
181
-
182
-
183
-
184
-
185
-
186
-
187
-
188
-
189
-
190
-
191
-
192
-
193
-
194
-
195
-
196
-
197
-
198
-
199
-
200
-
201
-
202
-
203
-
204
-
205
-
206
-
207
-
208
-
209
-
210
-
211
-
212
-
213
-
214
-
215
-
216
-
217
-
218
-
219
-
220
-
221
-
222
-
223
-
224
-
225
-
226
-
227
-
228
 |
 |

Notes to Consolidated Financial Statements (Continued)
114
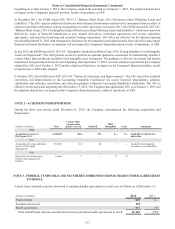
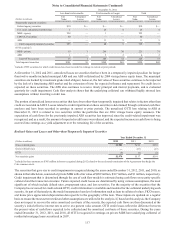
Securities purchased under agreements to resell are primarily collateralized by U.S. government or agency securities and are
carried at the amounts at which securities will be subsequently resold. Securities borrowed are primarily collateralized by
corporate securities. The Company takes possession of all securities under agreements to resell and securities borrowed and
performs the appropriate margin evaluation on the acquisition date based on market volatility, as necessary. It is the Company's
policy to obtain possession of collateral with a fair value between 95% to 110% of the principal amount loaned under resale
and securities borrowing agreements. The total market value of the collateral held was $1.1 billion and $806 million at
December 31, 2012 and 2011, of which $246 million and $247 million was repledged, respectively.
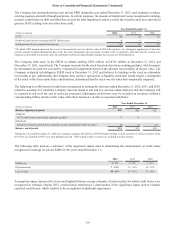
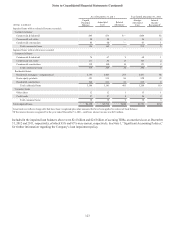
NOTE 4 - TRADING ASSETS AND LIABILITIES
The fair values of the components of trading assets and liabilities as of December 31 were as follows:
(Dollars in millions) 2012 2011
Trading Assets:
U.S. Treasury securities $111 $144
Federal agency securities 462 478
U.S. states and political subdivisions 34 54
MBS - agency 432 412
CDO/CLO securities 55 45
ABS 36 37
Corporate and other debt securities 567 345
CP 28 229
Equity securities 100 91
Derivatives 11,905 2,414
Trading loans 22,319 2,030
Total trading assets $6,049 $6,279
Trading Liabilities:
U.S. Treasury securities $582 $569
Corporate and other debt securities 173 77
Equity securities 937
Derivatives 1397 1,123
Total trading liabilities $1,161 $1,806
1 Amounts are offset with cash collateral received from or deposited with counterparties when the contracts are subject to ISDA master netting arrangements.
2 Includes loans related to TRS.
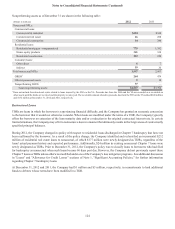
Various trading products and instruments are used as part of the Company’s overall balance sheet management strategies and
to support client requirements executed through the Bank and/or its broker/dealer subsidiary. The Company manages the
potential market volatility associated with the trading instruments that are utilized for balance sheet management with
appropriate risk management strategies. The size, volume and nature of the trading products and instruments can vary based
on economic, client specific, and Company specific asset or liability conditions. Product offerings to clients include debt
securities, loans traded in the secondary market, equity securities, derivative and foreign exchange contracts, and similar
financial instruments. Other trading-related activities include acting as a market maker in certain debt and equity securities
and related derivatives. The Company has policies and procedures to manage market risk associated with client trading activities
and assumes a limited degree of market risk by managing the size and nature of its exposure. The Company has pledged $727
million and $770 million of certain trading assets and cash equivalents to secure $703 million and $747 million of repurchase
agreements as of December 31, 2012 and 2011, respectively.