SunTrust 2012 Annual Report Download - page 45
Download and view the complete annual report
Please find page 45 of the 2012 SunTrust annual report below. You can navigate through the pages in the report by either clicking on the pages listed below, or by using the keyword search tool below to find specific information within the annual report.-
 1
1 -
2
-
3
-
4
-
5
-
6
-
7
-
8
-
9
-
10
-
11
-
12
-
13
-
14
-
15
-
16
-
17
-
18
-
19
-
20
-
21
-
22
-
23
-
24
-
25
-
26
-
27
-
28
-
29
-
30
-
31
-
32
-
33
-
34
-
 35
35 -
 36
36 -
 37
37 -
 38
38 -
 39
39 -
 40
40 -
 41
41 -
 42
42 -
 43
43 -
 44
44 -
 45
45 -
 46
46 -
 47
47 -
 48
48 -
 49
49 -
 50
50 -
 51
51 -
 52
52 -
 53
53 -
 54
54 -
 55
55 -
56
-
57
-
58
-
59
-
60
-
61
-
62
-
63
-
64
-
65
-
66
-
67
-
68
-
69
-
70
-
71
-
72
-
73
-
74
-
75
-
76
-
77
-
78
-
79
-
80
-
81
-
82
-
83
-
84
-
85
-
86
-
87
-
88
-
89
-
90
-
91
-
92
-
93
-
94
-
95
-
96
-
97
-
98
-
99
-
100
-
101
-
102
-
103
-
104
-
105
-
106
-
107
-
108
-
109
-
110
-
111
-
112
-
113
-
114
-
115
-
116
-
117
-
118
-
119
-
120
-
121
-
122
-
123
-
124
-
125
-
126
-
127
-
128
-
129
-
130
-
131
-
132
-
133
-
134
-
135
-
136
-
137
-
138
-
139
-
140
-
141
-
142
-
143
-
144
-
145
-
146
-
147
-
148
-
149
-
150
-
151
-
152
-
153
-
154
-
155
-
156
-
157
-
158
-
159
-
160
-
161
-
162
-
163
-
164
-
165
-
166
-
167
-
168
-
169
-
170
-
171
-
172
-
173
-
174
-
175
-
176
-
177
-
178
-
179
-
180
-
181
-
182
-
183
-
184
-
185
-
186
-
187
-
188
-
189
-
190
-
191
-
192
-
193
-
194
-
195
-
196
-
197
-
198
-
199
-
200
-
201
-
202
-
203
-
204
-
205
-
206
-
207
-
208
-
209
-
210
-
211
-
212
-
213
-
214
-
215
-
216
-
217
-
218
-
219
-
220
-
221
-
222
-
223
-
224
-
225
-
226
-
227
-
228
 |
 |

29
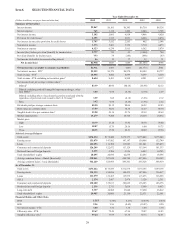
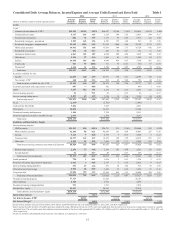
Item 6. SELECTED FINANCIAL DATA
Year Ended December 31
(Dollars in millions, except per share and other data) 2012 2011 2010 2009 2008
Summary of Operations
Interest income $5,867 $6,181 $6,343 $6,710 $8,328
Interest expense 765 1,116 1,489 2,244 3,708
Net interest income 5,102 5,065 4,854 4,466 4,620
Provision for credit losses11,395 1,513 2,651 4,064 2,474
Net interest income after provision for credit losses 3,707 3,552 2,203 402 2,146
Noninterest income 5,373 3,421 3,729 3,710 4,473
Noninterest expense 6,323 6,234 5,911 6,562 5,879
Income/(loss) before provision/(benefit) for income taxes 2,757 739 21 (2,450) 740
Provision/(benefit) for income taxes 773 79 (185) (898) (67)
Net income attributable to noncontrolling interest 26 13 17 12 11
Net income/(loss) $1,958 $647 $189 ($1,564) $796
Net income/(loss) available to common shareholders $1,931 $495 ($87) ($1,733) $741
Net interest income - FTE2$5,225 $5,179 $4,970 $4,589 $4,737
Total revenue - FTE210,598 8,600 8,699 8,299 9,210
Total revenue - FTE excluding net securities gains28,624 8,483 8,508 8,201 8,137
Net income/(loss) per average common share3:
Diluted4$3.59 $0.94 ($0.18) ($3.98) $2.12
Diluted excluding goodwill/intangible impairment charges, other
than MSRs2,4 3.60 0.94 (0.18) (2.34) 2.19
Diluted excluding effect of accelerated accretion associated with the
repurchase of preferred stock issued to the U.S. Treasury2,4 3.59 1.08 (0.18) (3.98) 2.12
Basic 3.62 0.94 (0.18) (3.98) 2.12
Dividends paid per average common share $0.20 $0.12 $0.04 $0.22 $2.85
Book value per common share 37.59 36.86 36.34 35.29 48.74
Tangible book value per common share225.98 25.18 23.76 22.59 28.69
Market capitalization 15,279 9,504 14,768 10,128 10,472
Market price:
High 30.79 33.14 31.92 30.18 70.00
Low 18.07 15.79 20.16 6.00 19.75
Close 28.35 17.70 29.51 20.29 29.54
Selected Average Balances
Total assets $176,134 $172,440 $172,375 $175,442 $175,848
Earning assets 153,479 147,802 147,187 150,908 152,749
Loans 122,893 116,308 113,925 121,041 125,433
Consumer and commercial deposits 126,249 122,672 117,129 113,164 101,333
Brokered time and foreign deposits 2,255 2,386 2,916 6,082 14,743
Total shareholders’ equity 20,495 20,696 22,834 22,286 18,596
Average common shares - diluted (thousands) 538,061 527,618 498,744 437,486 350,183
Average common shares - basic (thousands) 534,149 523,995 495,361 435,328 348,919
As of December 31
Total assets $173,442 $176,859 $172,874 $174,165 $189,138
Earning assets 151,223 154,696 148,473 147,896 156,017
Loans 121,470 122,495 115,975 113,675 126,998
ALLL 2,174 2,457 2,974 3,120 2,351
Consumer and commercial deposits 130,180 125,611 120,025 116,303 105,276
Brokered time and foreign deposits 2,136 2,311 3,019 5,560 8,053
Long-term debt 9,357 10,908 13,648 17,490 26,812
Total shareholders’ equity 20,985 20,066 23,130 22,531 22,501
Financial Ratios and Other Data
ROA 1.11% 0.38% 0.11% (0.89)% 0.45%
ROE 9.56 2.56 (0.49) (10.07) 4.20
Net interest margin - FTE 3.40 3.50 3.38 3.04 3.10
Efficiency ratio - FTE 59.67 72.49 67.94 79.07 63.83
Tangible efficiency ratio259.24 71.99 67.36 69.35 62.51