SunTrust 2012 Annual Report Download - page 68
Download and view the complete annual report
Please find page 68 of the 2012 SunTrust annual report below. You can navigate through the pages in the report by either clicking on the pages listed below, or by using the keyword search tool below to find specific information within the annual report.-
 1
1 -
2
-
3
-
4
-
5
-
6
-
7
-
8
-
9
-
10
-
11
-
12
-
13
-
14
-
15
-
16
-
17
-
18
-
19
-
20
-
21
-
22
-
23
-
24
-
25
-
26
-
27
-
28
-
29
-
30
-
31
-
32
-
33
-
34
-
35
-
36
-
37
-
38
-
39
-
40
-
41
-
42
-
43
-
44
-
45
-
46
-
47
-
48
-
49
-
50
-
51
-
52
-
53
-
54
-
55
-
56
-
57
-
 58
58 -
 59
59 -
 60
60 -
 61
61 -
 62
62 -
 63
63 -
 64
64 -
 65
65 -
 66
66 -
 67
67 -
 68
68 -
 69
69 -
 70
70 -
 71
71 -
 72
72 -
 73
73 -
 74
74 -
 75
75 -
 76
76 -
 77
77 -
 78
78 -
79
-
80
-
81
-
82
-
83
-
84
-
85
-
86
-
87
-
88
-
89
-
90
-
91
-
92
-
93
-
94
-
95
-
96
-
97
-
98
-
99
-
100
-
101
-
102
-
103
-
104
-
105
-
106
-
107
-
108
-
109
-
110
-
111
-
112
-
113
-
114
-
115
-
116
-
117
-
118
-
119
-
120
-
121
-
122
-
123
-
124
-
125
-
126
-
127
-
128
-
129
-
130
-
131
-
132
-
133
-
134
-
135
-
136
-
137
-
138
-
139
-
140
-
141
-
142
-
143
-
144
-
145
-
146
-
147
-
148
-
149
-
150
-
151
-
152
-
153
-
154
-
155
-
156
-
157
-
158
-
159
-
160
-
161
-
162
-
163
-
164
-
165
-
166
-
167
-
168
-
169
-
170
-
171
-
172
-
173
-
174
-
175
-
176
-
177
-
178
-
179
-
180
-
181
-
182
-
183
-
184
-
185
-
186
-
187
-
188
-
189
-
190
-
191
-
192
-
193
-
194
-
195
-
196
-
197
-
198
-
199
-
200
-
201
-
202
-
203
-
204
-
205
-
206
-
207
-
208
-
209
-
210
-
211
-
212
-
213
-
214
-
215
-
216
-
217
-
218
-
219
-
220
-
221
-
222
-
223
-
224
-
225
-
226
-
227
-
228
 |
 |

52
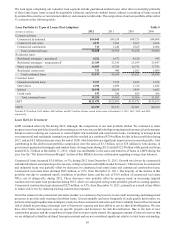
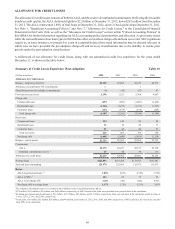
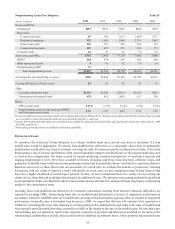
ALLL and Reserve for Unfunded Commitments
Allowance for Loan Losses by Loan Segment Table 12
2012 2011 2010
(Dollars in millions) ALLL
Segment
ALLL
as a % of
total ALLL
Loan
segment
as a % of
total loans ALLL
Segment
ALLL
as a % of
total ALLL
Loan
segment
as a % of
total loans ALLL
Segment
ALLL
as a % of
total ALLL
Loan
segment
as a % of
total loans
Commercial loans $902 41% 48% $964 39% 46% $1,303 44% 46%
Residential loans 1,131 52 36 1,354 55 38 1,498 50 40
Consumer loans 141 7 16 139 6 16 173 6 14
Total $2,174 100% 100% $2,457 100% 100% $2,974 100% 100%
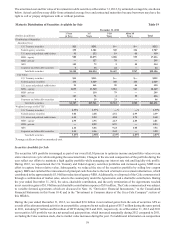
The ALLL decreased by $283 million, or 12%, during 2012, with commercial and residential loans-related ALLL declining
$62 million and $223 million, respectively. The decrease in ALLL was reflective of the continued improvement in the credit
quality trends of our loan portfolio as evidenced by reductions in higher-risk balances, lower NPLs, and improved early stage
delinquencies. Our risk profile continued to improve, as the amount of certain higher-risk loans continued to decline, while
government-guaranteed loans comprised 8% of the portfolio at December 31, 2012. The variables most impacting the ALLL
continue to be unemployment, residential real estate property values, and the variability and relative strength of the housing
market. At December 31, 2012, the ALLL to period-end loans ratio was 1.80%, down 21 basis points from December 31,
2011, consistent with continued improvement in asset quality. When excluding government-guaranteed loans, the ALLL to
period-end loans declined to 1.95% at December 31, 2012, compared to 2.27% at December 31, 2011. The ratio of the ALLL
to total NPLs was 142% at December 31, 2012, compared to 85% at December 31, 2011. The increase in this ratio was
primarily attributable to the $1.4 billion decline in NPLs, partially offset by the reduction in ALLL.
The reserve for unfunded commitments was $45 million at December 31, 2012, a decrease of $3 million compared to
December 31, 2011. The decrease was primarily driven by lower levels of nonperforming wholesale unfunded commitments
and associated reserves.
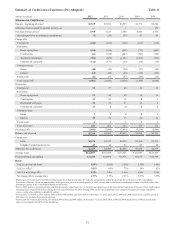
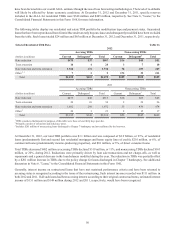
Allowance for Loan Losses by Loan Segment (Pre-Adoption) Table 13
(Dollars in millions) 2012 2011 2010 2009 2008
Allocation by Loan Type
Commercial loans $571 $479 $477 $650 $631
Real estate loans 1,448 1,820 2,238 2,268 1,523
Consumer loans 155 158 259 202 197
Total $2,174 $2,457 $2,974 $3,120 $2,351
Year-end Loan Types as a Percent of Total Loans
Commercial loans 37% 33% 29% 29% 32%
Real estate loans 46 50 56 60 58
Consumer loans 17 17 15 11 10
Total 100% 100% 100% 100% 100%
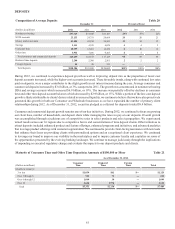
NONPERFORMING ASSETS
While the reclassification of our loan types in 2010 had no effect on total NPLs, SEC regulations require us, in some instances,
to present five years of comparable data where trend information may be deemed relevant, in which case we have provided
the pre-adoption NPL classifications due to the inability to restate prior periods under the post-adoption classifications.