SunTrust 2012 Annual Report Download - page 50
Download and view the complete annual report
Please find page 50 of the 2012 SunTrust annual report below. You can navigate through the pages in the report by either clicking on the pages listed below, or by using the keyword search tool below to find specific information within the annual report.-
 1
1 -
2
-
3
-
4
-
5
-
6
-
7
-
8
-
9
-
10
-
11
-
12
-
13
-
14
-
15
-
16
-
17
-
18
-
19
-
20
-
21
-
22
-
23
-
24
-
25
-
26
-
27
-
28
-
29
-
30
-
31
-
32
-
33
-
34
-
35
-
36
-
37
-
38
-
39
-
 40
40 -
 41
41 -
 42
42 -
 43
43 -
 44
44 -
 45
45 -
 46
46 -
 47
47 -
 48
48 -
 49
49 -
 50
50 -
 51
51 -
 52
52 -
 53
53 -
 54
54 -
 55
55 -
 56
56 -
 57
57 -
 58
58 -
 59
59 -
 60
60 -
61
-
62
-
63
-
64
-
65
-
66
-
67
-
68
-
69
-
70
-
71
-
72
-
73
-
74
-
75
-
76
-
77
-
78
-
79
-
80
-
81
-
82
-
83
-
84
-
85
-
86
-
87
-
88
-
89
-
90
-
91
-
92
-
93
-
94
-
95
-
96
-
97
-
98
-
99
-
100
-
101
-
102
-
103
-
104
-
105
-
106
-
107
-
108
-
109
-
110
-
111
-
112
-
113
-
114
-
115
-
116
-
117
-
118
-
119
-
120
-
121
-
122
-
123
-
124
-
125
-
126
-
127
-
128
-
129
-
130
-
131
-
132
-
133
-
134
-
135
-
136
-
137
-
138
-
139
-
140
-
141
-
142
-
143
-
144
-
145
-
146
-
147
-
148
-
149
-
150
-
151
-
152
-
153
-
154
-
155
-
156
-
157
-
158
-
159
-
160
-
161
-
162
-
163
-
164
-
165
-
166
-
167
-
168
-
169
-
170
-
171
-
172
-
173
-
174
-
175
-
176
-
177
-
178
-
179
-
180
-
181
-
182
-
183
-
184
-
185
-
186
-
187
-
188
-
189
-
190
-
191
-
192
-
193
-
194
-
195
-
196
-
197
-
198
-
199
-
200
-
201
-
202
-
203
-
204
-
205
-
206
-
207
-
208
-
209
-
210
-
211
-
212
-
213
-
214
-
215
-
216
-
217
-
218
-
219
-
220
-
221
-
222
-
223
-
224
-
225
-
226
-
227
-
228
 |
 |
34
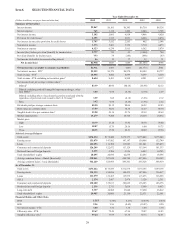
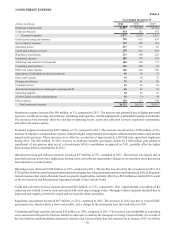
average diluted common share. Results in 2012 compared to 2011 were driven by the strategic actions in 2012 noted above, which
added approximately $750 million, after tax, to net income available to common shareholders, or $1.40 per average diluted common
share. Earnings were also positively impacted during 2012 by improvements in net interest income and mortgage origination
income. Additionally, 2012 did not include preferred dividends paid to the U.S. Treasury, while 2011 results included those
dividends, as well as a non-cash charge related to the accelerated accretion associated with repayment of the U.S. government's
TARP investment in March 2011. To a lesser extent, results were impacted by an improvement in the provision for credit losses
of 8% during 2012 compared to 2011. As credit quality continues to improve, the impact to net income available to common
shareholders due to lower provisions for credit losses is expected to be less substantial in future periods. Also positively impacting
earnings in 2012 was a 28% reduction in credit-related expenses and operating losses, driven by credit quality improvement in
2012. We believe these expenses continue to be elevated at current levels and as such, believe that 2013 earnings will be positively
impacted by further declines as credit quality and the economy continue to improve. Additionally, we expect continued net interest
margin compression in 2013 due to the continued low interest rate environment, as well as some abatement in the future of mortgage
loan refinance activity, which benefited us in 2012.
We made significant progress in our PPG expense initiative, surpassing the goal of realizing $300 million in annualized savings
through this program a year ahead of schedule. Since we began our efforts in mid-2011 to drive efficiency improvements through
reducing expenses and growing revenues, our core revenue has increased, expenses moderated slightly during the latter part of
2012, and our efficiency ratio has improved. While the PPG program is complete, we expect to continue our efforts to become a
more efficient organization and we continue to focus on revenue and expense initiatives in pursuit of our long-term efficiency ratio
target of below 60%.
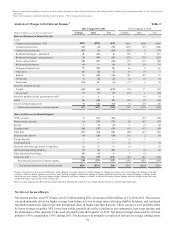
Our asset quality metrics improved significantly in 2012, driven in part by the strategic actions executed primarily during the
second half of the year specifically designed to improve our risk profile, as well as through improved core credit quality trends.
Total NPLs continued the downward trend that began in 2010, with a decline of 47% from December 31, 2011, driven by NPL
sales, reduced inflows into nonaccrual, and problem loan resolution efforts. Declines in NPLs were experienced in all categories,
with the largest declines coming from the residential and commercial portfolios, despite some inflows as a result of regulatory
guidance issued during the year. OREO declined 45% compared to the prior year, totaling less than 0.2% of total assets at December
31, 2012, which was the result of continued disposition of properties once we had clear title, coupled with a moderation of inflows.
Our restructured loan portfolio declined 13% compared to December 31, 2011, with decreases in both the nonaccruing and accruing
loan populations. Further, the accruing restructured portfolio continued to exhibit strong payment performance with 95% current
on principal and interest payments at December 31, 2012. Early stage delinquencies, a leading indicator of asset quality, particularly
for consumer loans, declined during 2012, both in total and when excluding government-guaranteed loan delinquencies. This
decline was a result of our ongoing efforts to reduce risk in the portfolio as evidenced by declines in certain higher-risk loans and
strategic loan sales.
At December 31, 2012, the ALLL ratio was 1.80% of total loans, a decline of 21 basis points compared to December 31, 2011,
due to decreases in the ALLL primarily as a result of improving core credit quality trends despite the additions to NPLs during
the year related to policy changes. The provision for loan losses decreased 8% and net charge-offs decreased 18% for the year
ended December 31, 2012 compared to the same period in 2011, both as a result of improved credit quality. Charge-offs declined
during the year despite charge-off increases related to the strategic loan sales and policy changes. See additional discussion of the
policy changes and credit and asset quality in the “Loans,” “Allowance for Credit Losses,” “Nonperforming Assets,” and
“Restructured Loans,” sections of this MD&A.
Average loans increased 6% during 2012 compared to 2011, led by an increase in commercial and industrial loans. Additionally,
the acquisition of guaranteed residential mortgage and guaranteed student loan portfolios late in 2011 drove significant increases
in these loan categories. We also experienced increases in all consumer loan categories and non-guaranteed residential mortgages.
Partially offsetting these increases during the year were intentional declines in commercial and residential construction loans,
home equity loans, and commercial real estate loans as we managed these loan categories down to further strengthen our balance
sheet.
While average loans were higher during 2012 compared to 2011, at December 31, 2012, our total loan portfolio was down 1%
compared to December 31, 2011. The driver of this decline was our decision to sell certain loans, primarily during the second half
of the year. Declines in guaranteed residential mortgages and guaranteed student loans drove the decline in these loan categories
and were primarily the result of loan sales. The sales of government-guaranteed loans during 2012 caused a decline in the percentage
of our loan portfolio that is government-guaranteed to 8% at December 31, 2012 compared to 11% at December 31, 2011. This
decline was not unexpected, as we made a decision to grow government-guaranteed loans over the past several years as a transition
to a time of organic loan growth. As 2012 progressed, we experienced increased organic loan growth and a continued decline in
our higher-risk loan balances, which influenced our decision to sell certain guaranteed loans. These sales reduced the size of our
government-guaranteed portfolio to a level more consistent with our longer-term balance sheet targets.