SunTrust 2012 Annual Report Download - page 77
Download and view the complete annual report
Please find page 77 of the 2012 SunTrust annual report below. You can navigate through the pages in the report by either clicking on the pages listed below, or by using the keyword search tool below to find specific information within the annual report.-
 1
1 -
2
-
3
-
4
-
5
-
6
-
7
-
8
-
9
-
10
-
11
-
12
-
13
-
14
-
15
-
16
-
17
-
18
-
19
-
20
-
21
-
22
-
23
-
24
-
25
-
26
-
27
-
28
-
29
-
30
-
31
-
32
-
33
-
34
-
35
-
36
-
37
-
38
-
39
-
40
-
41
-
42
-
43
-
44
-
45
-
46
-
47
-
48
-
49
-
50
-
51
-
52
-
53
-
54
-
55
-
56
-
57
-
58
-
59
-
60
-
61
-
62
-
63
-
64
-
65
-
66
-
 67
67 -
 68
68 -
 69
69 -
 70
70 -
 71
71 -
 72
72 -
 73
73 -
 74
74 -
 75
75 -
 76
76 -
 77
77 -
 78
78 -
 79
79 -
 80
80 -
 81
81 -
 82
82 -
 83
83 -
 84
84 -
 85
85 -
 86
86 -
 87
87 -
88
-
89
-
90
-
91
-
92
-
93
-
94
-
95
-
96
-
97
-
98
-
99
-
100
-
101
-
102
-
103
-
104
-
105
-
106
-
107
-
108
-
109
-
110
-
111
-
112
-
113
-
114
-
115
-
116
-
117
-
118
-
119
-
120
-
121
-
122
-
123
-
124
-
125
-
126
-
127
-
128
-
129
-
130
-
131
-
132
-
133
-
134
-
135
-
136
-
137
-
138
-
139
-
140
-
141
-
142
-
143
-
144
-
145
-
146
-
147
-
148
-
149
-
150
-
151
-
152
-
153
-
154
-
155
-
156
-
157
-
158
-
159
-
160
-
161
-
162
-
163
-
164
-
165
-
166
-
167
-
168
-
169
-
170
-
171
-
172
-
173
-
174
-
175
-
176
-
177
-
178
-
179
-
180
-
181
-
182
-
183
-
184
-
185
-
186
-
187
-
188
-
189
-
190
-
191
-
192
-
193
-
194
-
195
-
196
-
197
-
198
-
199
-
200
-
201
-
202
-
203
-
204
-
205
-
206
-
207
-
208
-
209
-
210
-
211
-
212
-
213
-
214
-
215
-
216
-
217
-
218
-
219
-
220
-
221
-
222
-
223
-
224
-
225
-
226
-
227
-
228
 |
 |

61
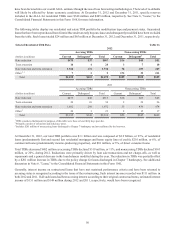
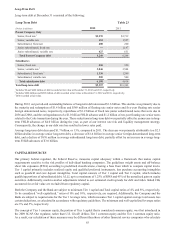
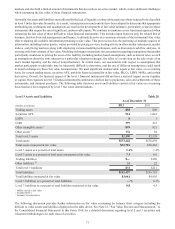
DEPOSITS
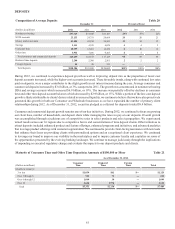
Composition of Average Deposits Table 20
December 31 Percent of Total
(Dollars in millions) 2012 2011 2010 2012 2011 2010
Noninterest-bearing $37,329 $31,045 $26,103 29% 25% 22%
NOW accounts 25,155 24,751 24,668 20 20 21
Money market accounts 42,101 42,854 38,893 33 34 32
Savings 5,113 4,535 4,028 44 3
Consumer time 10,597 12,451 14,232 810 12
Other time 5,954 7,036 9,205 45 8
Total consumer and commercial deposits 126,249 122,672 117,129 98 98 98
Brokered time deposits 2,204 2,306 2,561 22 2
Foreign deposits 51 80 355 —— —
Total deposits $128,504 $125,058 $120,045 100% 100% 100%
During 2012, we continued to experience deposit growth as well as improving deposit mix as the proportion of lower-cost
deposit accounts increased, while the higher-cost accounts decreased. These favorable trends, along with continued low rates
paid on deposits, were a major contributor to the slight growth in net interest income during the year. Average consumer and
commercial deposits increased by $3.6 billion, or 3%, compared to 2011. The growth was concentrated in noninterest bearing
DDA and savings accounts which increased $6.9 billion, or 19%. The increase was partially offset by declines in consumer
time and other time deposit account balances which decreased by $2.9 billion, or 15%. While a portion of the low-cost deposit
growth is likely attributable to clients’ desires related to increased liquidity, we continue to believe that we have also proactively
generated this growth in both our Consumer and Wholesale businesses as we have expanded the number of primary client
relationships during 2012. As of December 31, 2012, securities pledged as collateral for deposits totaled $8.4 billion.
Consumer and commercial deposit growth remains one of our key initiatives. During 2012, we continued to focus on growing
our client base, number of households, and deposit share while managing the rates we pay on our deposits. Overall growth
was accomplished through a judicious use of competitive rates in select products and select geographies. We experienced
mixed results across our 16 regions due to competitive forces and concentrations of time deposit clients. Other initiatives to
attract deposits included enhanced product and feature offerings, enhanced programs and initiatives, and advanced analytics
that leverage product offerings with customer segmentation. We continued to provide client-facing teammates with new tools
that enhance their focus on providing clients with personalized options and an exceptional client experience. We continued
to leverage our brand to improve our visibility in the marketplace and to inspire customer loyalty and capitalize on some of
the opportunities presented by the evolving banking landscape. We continue to manage judiciously through the implications
of impending or executed regulatory change and evaluate the impacts to our deposit products and clients.
Maturity of Consumer Time and Other Time Deposits in Amounts of $100,000 or More Table 21
As of December 31, 2012
(Dollars in millions) Consumer
Time Brokered
Time Foreign
Time Total
Months to maturity:
3 or less $1,059 $61 $— $1,120
Over 3 through 6 581 71 — 652
Over 6 through 12 1,069 30 — 1,099
Over 12 2,644 1,974 — 4,618
Total $5,353 $2,136 $— $7,489