SunTrust 2012 Annual Report Download - page 105
Download and view the complete annual report
Please find page 105 of the 2012 SunTrust annual report below. You can navigate through the pages in the report by either clicking on the pages listed below, or by using the keyword search tool below to find specific information within the annual report.-
 1
1 -
2
-
3
-
4
-
5
-
6
-
7
-
8
-
9
-
10
-
11
-
12
-
13
-
14
-
15
-
16
-
17
-
18
-
19
-
20
-
21
-
22
-
23
-
24
-
25
-
26
-
27
-
28
-
29
-
30
-
31
-
32
-
33
-
34
-
35
-
36
-
37
-
38
-
39
-
40
-
41
-
42
-
43
-
44
-
45
-
46
-
47
-
48
-
49
-
50
-
51
-
52
-
53
-
54
-
55
-
56
-
57
-
58
-
59
-
60
-
61
-
62
-
63
-
64
-
65
-
66
-
67
-
68
-
69
-
70
-
71
-
72
-
73
-
74
-
75
-
76
-
77
-
78
-
79
-
80
-
81
-
82
-
83
-
84
-
85
-
86
-
87
-
88
-
89
-
90
-
91
-
92
-
93
-
94
-
 95
95 -
 96
96 -
 97
97 -
 98
98 -
 99
99 -
 100
100 -
 101
101 -
 102
102 -
 103
103 -
 104
104 -
 105
105 -
 106
106 -
 107
107 -
 108
108 -
 109
109 -
 110
110 -
 111
111 -
 112
112 -
 113
113 -
 114
114 -
 115
115 -
116
-
117
-
118
-
119
-
120
-
121
-
122
-
123
-
124
-
125
-
126
-
127
-
128
-
129
-
130
-
131
-
132
-
133
-
134
-
135
-
136
-
137
-
138
-
139
-
140
-
141
-
142
-
143
-
144
-
145
-
146
-
147
-
148
-
149
-
150
-
151
-
152
-
153
-
154
-
155
-
156
-
157
-
158
-
159
-
160
-
161
-
162
-
163
-
164
-
165
-
166
-
167
-
168
-
169
-
170
-
171
-
172
-
173
-
174
-
175
-
176
-
177
-
178
-
179
-
180
-
181
-
182
-
183
-
184
-
185
-
186
-
187
-
188
-
189
-
190
-
191
-
192
-
193
-
194
-
195
-
196
-
197
-
198
-
199
-
200
-
201
-
202
-
203
-
204
-
205
-
206
-
207
-
208
-
209
-
210
-
211
-
212
-
213
-
214
-
215
-
216
-
217
-
218
-
219
-
220
-
221
-
222
-
223
-
224
-
225
-
226
-
227
-
228
 |
 |
89
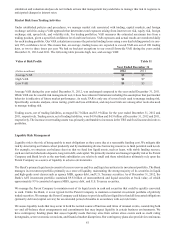
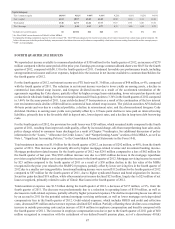
This was partially offset by a $315 million increase in average client deposit balances and continued favorable deposit mix
trends as low cost average deposits increased $3.0 billion, or 5%, offsetting a $2.6 billion, or 15%, decline in higher cost
average time deposits.
Provision for credit losses was $596 million, a decrease of $126 million, or 17%, compared to the same period in 2011. The
decrease was driven by declines in net charge-offs of: $70 million in home equity lines, $17 million in consumer indirect, $16
million in credit card, $10 million in residential mortgage loans, and $11 million in commercial. Included in these amounts
were: $43 million of incremental charge-offs related to a change in credit policy accelerating the charge-off of second lien
loans from 180 days to 120 days past due, and $31 million of incremental charge-offs related to a change in policy to recognize
charge-offs on loans discharged in Chapter 7 bankruptcy. See additional discussion of credit and asset quality in the “Loans,”
“Allowance for Credit Losses,” “Nonperforming Assets,” and “Restructured Loans,” sections of this MD&A.
Total noninterest income was $1.4 billion, a decrease of $138 million, or 9%, compared to the same period in 2011. Card fees
decreased $129 million compared to the same period in 2011 driven by regulations on debit interchange fee income that
became effective in the fourth quarter of 2011. Additionally, there was a $20 million decline in trust and investment management
income influenced by clients' desires for additional liquidity, largely offset by a $12 million increase in retail investment
income.
Total noninterest expense was $2.9 billion, an increase of $27 million, or 1%, compared to the same period in 2011. The
increase was driven by corporate overhead allocations that offset a decrease in expenses managed by the business, such as
reduced staff expense, other real estate, and operating supplies expense.
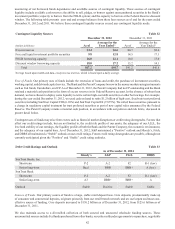
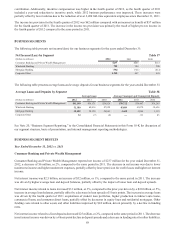
Wholesale Banking
Wholesale Banking reported record net income of $789 million for the year ended December 31, 2012, an increase of $405
million, compared to the same period in 2011. The increase in net income was attributable to decreases in provision for credit
losses and noninterest expense combined with increases in both net interest income and noninterest income.
Net interest income was $1.9 billion, a $125 million, or 7%, increase from the prior year, driven by higher loan and deposit
balances. Net interest income related to loans increased $80 million, or 8%, as average loan balances increased $3.4 billion,
or 7%, driven by increases in commercial and tax-exempt loans, partially offset by decreases in commercial real estate loans.
Net interest income related to deposits increased $21 million, or 3%, resulting from a $2.8 billion, or 7%, increase in client
deposit balances. Favorable trends in deposit mix continued as lower cost demand deposits increased $4.2 billion, or 21%,
while average combined interest-bearing transaction accounts and money market accounts decreased $1.1 billion, or 5%,
reflecting a continued shift in customer preference towards demand deposit products.
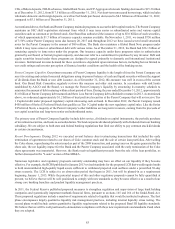
Provision for credit losses was $315 million, a decrease of $310 million, or 50%, from the prior year. The decrease was driven
by lower net charge-offs in commercial real estate and commercial loans, partially offset by an increase in net charge-offs
related to commercial real estate NPLs that were included in asset disposition transactions during 2012.
Total noninterest income was $1.5 billion, an increase of $141 million, or 10%, from the prior year, predominantly driven by
increased trading revenue, investment banking revenue, leasing gains, and loan fees. These increases were partially offset by
declines in card services revenue due to lower rates driven by regulations that became effective beginning in the fourth quarter
of 2011, letter of credit fees, and service charges on deposit accounts.
Total noninterest expense was $2.0 billion, a decrease of $92 million, or 4%, compared to the prior year. Noninterest expense
included impairment charges of $96 million related to planned affordable housing partnership interests dispositions, which
are expected to be completed in 2013. Partially offsetting the impairment charges were the favorable settlement of litigation
claims and continued declines in other real estate related expense and staff expense.
Mortgage Banking
Mortgage Banking reported a net loss of $702 million for the year ended December 31, 2012, an improvement of $19 million,
or 3%, compared to the same period in 2011. The improvement was driven by higher gains on sale of loans and improved net
MSR hedge performance that was largely offset by higher provision for credit losses, provision for mortgage repurchases,
and noninterest expenses. During 2012, strategic actions were taken to improve the risk profile and strengthen the balance
sheet. Those actions included additional provision for mortgage repurchases expected to cover pre-2009 GSE demands, higher
provision for loan losses associated with charge-offs related to nonperforming loan sales, and market valuation losses associated
with the transfer to LHFS and subsequent sale of Ginnie Mae loans.