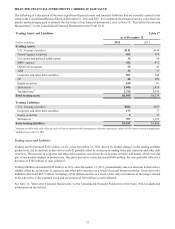
SunTrust 2012 Annual Report Download - page 67
Download and view the complete annual report
Please find page 67 of the 2012 SunTrust annual report below. You can navigate through the pages in the report by either clicking on the pages listed below, or by using the keyword search tool below to find specific information within the annual report.-
 1
1 -
2
-
3
-
4
-
5
-
6
-
7
-
8
-
9
-
10
-
11
-
12
-
13
-
14
-
15
-
16
-
17
-
18
-
19
-
20
-
21
-
22
-
23
-
24
-
25
-
26
-
27
-
28
-
29
-
30
-
31
-
32
-
33
-
34
-
35
-
36
-
37
-
38
-
39
-
40
-
41
-
42
-
43
-
44
-
45
-
46
-
47
-
48
-
49
-
50
-
51
-
52
-
53
-
54
-
55
-
56
-
 57
57 -
 58
58 -
 59
59 -
 60
60 -
 61
61 -
 62
62 -
 63
63 -
 64
64 -
 65
65 -
 66
66 -
 67
67 -
 68
68 -
 69
69 -
 70
70 -
 71
71 -
 72
72 -
 73
73 -
 74
74 -
 75
75 -
 76
76 -
 77
77 -
78
-
79
-
80
-
81
-
82
-
83
-
84
-
85
-
86
-
87
-
88
-
89
-
90
-
91
-
92
-
93
-
94
-
95
-
96
-
97
-
98
-
99
-
100
-
101
-
102
-
103
-
104
-
105
-
106
-
107
-
108
-
109
-
110
-
111
-
112
-
113
-
114
-
115
-
116
-
117
-
118
-
119
-
120
-
121
-
122
-
123
-
124
-
125
-
126
-
127
-
128
-
129
-
130
-
131
-
132
-
133
-
134
-
135
-
136
-
137
-
138
-
139
-
140
-
141
-
142
-
143
-
144
-
145
-
146
-
147
-
148
-
149
-
150
-
151
-
152
-
153
-
154
-
155
-
156
-
157
-
158
-
159
-
160
-
161
-
162
-
163
-
164
-
165
-
166
-
167
-
168
-
169
-
170
-
171
-
172
-
173
-
174
-
175
-
176
-
177
-
178
-
179
-
180
-
181
-
182
-
183
-
184
-
185
-
186
-
187
-
188
-
189
-
190
-
191
-
192
-
193
-
194
-
195
-
196
-
197
-
198
-
199
-
200
-
201
-
202
-
203
-
204
-
205
-
206
-
207
-
208
-
209
-
210
-
211
-
212
-
213
-
214
-
215
-
216
-
217
-
218
-
219
-
220
-
221
-
222
-
223
-
224
-
225
-
226
-
227
-
228
 |
 |

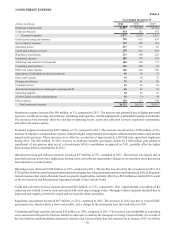
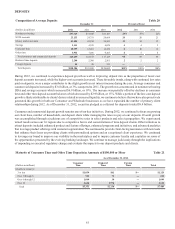
51
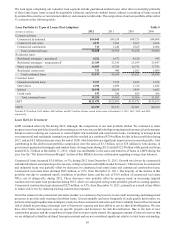
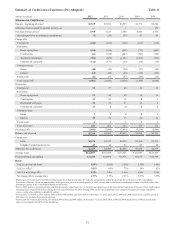
Summary of Credit Losses Experience (Pre-Adoption) Table 11
(Dollars in millions) 2012 2011 2010 2009 2008
Allowance for Credit Losses
Balance - beginning of period $2,505 $3,032 $3,235 $2,379 $1,290
Allowance from acquisitions & other activity, net —— 1 — 159
Provision for loan losses 1,398 1,523 2,708 4,007 2,474
(Benefit)/provision for unfunded commitments1(3) (10) (57) 87 20
Charge-offs:
Commercial (218) (268) (386) (613) (219)
Real estate:
Home equity lines (436) (496) (591) (715) (449)
Construction (85) (334) (447) (507) (194)
Residential mortgages2(906) (822) (1,281) (1,236) (525)
Commercial real estate (112) (137) (92) (32) (25)
Consumer loans:
Direct (48) (48) (50) (57) (42)
Indirect (61) (80) (84) (152) (193)
Credit cards (41) (56) (87) (86) (33)
Total charge-offs (1,907) (2,241) (3,018) (3,398) (1,680)
Recoveries:
Commercial 54 57 46 40 24
Real estate:
Home equity lines 52 40 40 30 16
Construction 21 29 12 8 3
Residential mortgages 34 22 21 18 8
Commercial real estate 23 8 (2) 4 1
Consumer loans:
Direct 78 8 8 8
Indirect 29 32 33 49 54
Credit cards 65 5 3 2
Total recoveries 226 201 163 160 116
Net charge-offs (1,681) (2,040) (2,855) (3,238) (1,564)
Balance-end of period $2,219 $2,505 $3,032 $3,235 $2,379
Components:
ALLL $2,174 $2,457 $2,974 $3,120 $2,351
Unfunded commitments reserve 45 48 58 115 28
Allowance for credit losses $2,219 $2,505 $3,032 $3,235 $2,379
Average loans $122,893 $116,308 $113,925 $121,041 $125,433
Period-end loans outstanding 121,470 122,495 115,975 113,675 126,998
Ratios:
ALLL to period-end loans31.80% 2.01% 2.58% 2.76% 1.86%
ALLL to NPLs4142% 85% 73% 59% 62%
ALLL to net charge-offs 1.29x 1.20x 1.04x 0.96x 1.50x
Net charge-offs to average loans 1.37% 1.75% 2.51% 2.67% 1.25%
1 Beginning in the fourth quarter of 2009, SunTrust began recording the provision for unfunded commitments within the provision for credit losses in the Consolidated
Statements of Income. Given the immateriality of this provision, prior to the fourth quarter of 2009, the provision for unfunded commitments remains classified within other
noninterest expense in the Consolidated Statements of Income.
2 Prior to 2009, borrower misrepresentation and denied insurance claim losses were recorded as operating losses in the Consolidated Statements of Income. These credit-related
operating losses totaled $160 million during the year ended December 31, 2008. During 2009, credit-related operating losses charged-off against previously established
reserves within other liabilities totaled $195 million.
3 For this ratio, $379 million, $433 million, $492 million, $449 million, and $270 million at December 31, 2012, 2011, 2010, 2009, and 2008, respectively, of LHFI carried at
fair value were excluded from period-end loans.
4 For the ratio, $19 million, $25 million, $28 million, $46 million, and $46 million, at December 31, 2012, 2011, 2010, 2009, and 2008, respectively, of NPLs carried at fair
value were excluded from NPLs in the calculation.