SunTrust 2012 Annual Report Download - page 111
Download and view the complete annual report
Please find page 111 of the 2012 SunTrust annual report below. You can navigate through the pages in the report by either clicking on the pages listed below, or by using the keyword search tool below to find specific information within the annual report.-
 1
1 -
2
-
3
-
4
-
5
-
6
-
7
-
8
-
9
-
10
-
11
-
12
-
13
-
14
-
15
-
16
-
17
-
18
-
19
-
20
-
21
-
22
-
23
-
24
-
25
-
26
-
27
-
28
-
29
-
30
-
31
-
32
-
33
-
34
-
35
-
36
-
37
-
38
-
39
-
40
-
41
-
42
-
43
-
44
-
45
-
46
-
47
-
48
-
49
-
50
-
51
-
52
-
53
-
54
-
55
-
56
-
57
-
58
-
59
-
60
-
61
-
62
-
63
-
64
-
65
-
66
-
67
-
68
-
69
-
70
-
71
-
72
-
73
-
74
-
75
-
76
-
77
-
78
-
79
-
80
-
81
-
82
-
83
-
84
-
85
-
86
-
87
-
88
-
89
-
90
-
91
-
92
-
93
-
94
-
95
-
96
-
97
-
98
-
99
-
100
-
 101
101 -
 102
102 -
 103
103 -
 104
104 -
 105
105 -
 106
106 -
 107
107 -
 108
108 -
 109
109 -
 110
110 -
 111
111 -
 112
112 -
 113
113 -
 114
114 -
 115
115 -
 116
116 -
 117
117 -
 118
118 -
 119
119 -
 120
120 -
 121
121 -
122
-
123
-
124
-
125
-
126
-
127
-
128
-
129
-
130
-
131
-
132
-
133
-
134
-
135
-
136
-
137
-
138
-
139
-
140
-
141
-
142
-
143
-
144
-
145
-
146
-
147
-
148
-
149
-
150
-
151
-
152
-
153
-
154
-
155
-
156
-
157
-
158
-
159
-
160
-
161
-
162
-
163
-
164
-
165
-
166
-
167
-
168
-
169
-
170
-
171
-
172
-
173
-
174
-
175
-
176
-
177
-
178
-
179
-
180
-
181
-
182
-
183
-
184
-
185
-
186
-
187
-
188
-
189
-
190
-
191
-
192
-
193
-
194
-
195
-
196
-
197
-
198
-
199
-
200
-
201
-
202
-
203
-
204
-
205
-
206
-
207
-
208
-
209
-
210
-
211
-
212
-
213
-
214
-
215
-
216
-
217
-
218
-
219
-
220
-
221
-
222
-
223
-
224
-
225
-
226
-
227
-
228
 |
 |
95
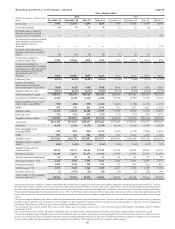
3We present a tangible efficiency ratio which excludes the impairment/amortization of goodwill/intangible assets other than MSRs. We believe this measure is useful to investors
because, by removing the effect of these intangible asset costs (the level of which may vary from company to company), it allows investors to more easily compare our efficiency
to other companies in the industry. This measure is utilized by us to assess our efficiency and that of our lines of business.
4Goodwill is deducted net of deferred taxes to determine Tier 1 capital. Deferred taxes of $163 million, $154 million, $134 million, $115 million, and $102 million are excluded
from 2012, 2011, 2010, 2009, and 2008, respectively.
5Other intangible assets are deducted net of deferred taxes to determine Tier 1 capital. Deferred taxes of $7 million, $16 million, $26 million, $40 million, and $57 million are
excluded from 2012, 2011, 2010, 2009, and 2008, respectively.
6We present a tangible equity to tangible assets ratio that excludes the after-tax impact of purchase accounting intangible assets. We believe this measure is useful to investors
because, by removing the effect of intangible assets that result from merger and acquisition activity (the level of which may vary from company to company), it allows investors
to more easily compare our capital adequacy to other companies in the industry. This measure is used by us to analyze capital adequacy.
7We present a tangible book value per common share that excludes the after-tax impact of purchase accounting intangible assets and also excludes preferred stock from tangible
equity. We believe this measure is useful to investors because, by removing the effect of intangible assets that result from merger and acquisition activity as well as preferred stock
(the level of which may vary from company to company), it allows investors to more easily compare our book value on common stock to other companies in the industry.
8We present total revenue- FTE excluding net securities gains. Total Revenue is calculated as net interest income - FTE plus noninterest income. Net interest income is presented
on an FTE basis, which adjusts for the tax-favored status of net interest income from certain loans and investments. We believe this measure to be the preferred industry measurement
of net interest income and it enhances comparability of net interest income arising from taxable and tax-exempt sources. We also believe that noninterest income without net
securities gains is more indicative of our performance because it isolates income that is primarily client relationship and client transaction driven and is more indicative of normalized
operations.
9Primarily relates to the impacts of unrealized securities AFS gains and accrued pension liabilities recognized in AOCI.
10The proposed Basel III calculations of Tier 1 common equity, risk-weighted assets, and the Tier 1 common equity ratio are based upon our interpretation of the notice of proposed
rulemaking issued by the Federal Reserve in June 2012. The final Basel III ruling by the Federal Reserve is subject to potential changes from the proposed rulemaking, as is our
interpretation of the rules.
11The largest differences between the risk-weighted assets as calculated under Basel I and the Basel III proposal relate to the risk-weightings for mortgage, home equity, and
commercial real estate loans.
12Amounts are presented net of tax and include the impact to net income available to common shareholders of the strategic items announced during the third quarter of 2012. See
announcement of strategic actions in Form 8-K filed with the SEC on September 6, 2012. Net income available to common shareholders excluding the impact of these actions is
being used by the Compensation Committee of the Board for determining the AIP payment for 2012. See additional discussion in the annual proxy statement filed with the SEC.
13Amounts are presented before tax and exclude from total revenue - FTE and noninterest expense the impact of the strategic items announced during the third quarter of 2012 and
the impairment/amortization of goodwill/intangible assets. See announcement of strategic actions in Form 8-K filed with the SEC on September 6, 2012. Total Revenue - FTE
and noninterest expense excluding the impact of these actions and the impairment/amortization of goodwill/intangible assets is being used by the Compensation Committee of the
Board for calculating the tangible efficiency ratio in determining the AIP payment for 2012. See additional discussion in the annual proxy statement filed with the SEC.
14 ROA, excluding the impact of the strategic items announced during the third quarter of 2012 is being used by the Compensation Committee of the Board for determining the
AIP payment for 2012. See announcement of strategic actions in Form 8-K filed with the SEC on September 6, 2012 and additional discussion in the annual proxy statement filed
with the SEC. ROA, excluding the impact of strategic actions is calculated by dividing net income, excluding strategic actions, by average total assets.
15 Net income/(loss) per average common share, diluted, excluding the impact of strategic actions is included in the annual proxy statement filed with the SEC and is provided to
compare the net income/(loss) per average common diluted share in 2012 to 2011, which did not include similar strategic actions impact. See announcement of strategic actions
in Form 8-K filed with the SEC on September 6, 2012 and additional discussion in the annual proxy statement filed with the SEC.