SunTrust 2012 Annual Report Download - page 53
Download and view the complete annual report
Please find page 53 of the 2012 SunTrust annual report below. You can navigate through the pages in the report by either clicking on the pages listed below, or by using the keyword search tool below to find specific information within the annual report.-
 1
1 -
2
-
3
-
4
-
5
-
6
-
7
-
8
-
9
-
10
-
11
-
12
-
13
-
14
-
15
-
16
-
17
-
18
-
19
-
20
-
21
-
22
-
23
-
24
-
25
-
26
-
27
-
28
-
29
-
30
-
31
-
32
-
33
-
34
-
35
-
36
-
37
-
38
-
39
-
40
-
41
-
42
-
 43
43 -
 44
44 -
 45
45 -
 46
46 -
 47
47 -
 48
48 -
 49
49 -
 50
50 -
 51
51 -
 52
52 -
 53
53 -
 54
54 -
 55
55 -
 56
56 -
 57
57 -
 58
58 -
 59
59 -
 60
60 -
 61
61 -
 62
62 -
 63
63 -
64
-
65
-
66
-
67
-
68
-
69
-
70
-
71
-
72
-
73
-
74
-
75
-
76
-
77
-
78
-
79
-
80
-
81
-
82
-
83
-
84
-
85
-
86
-
87
-
88
-
89
-
90
-
91
-
92
-
93
-
94
-
95
-
96
-
97
-
98
-
99
-
100
-
101
-
102
-
103
-
104
-
105
-
106
-
107
-
108
-
109
-
110
-
111
-
112
-
113
-
114
-
115
-
116
-
117
-
118
-
119
-
120
-
121
-
122
-
123
-
124
-
125
-
126
-
127
-
128
-
129
-
130
-
131
-
132
-
133
-
134
-
135
-
136
-
137
-
138
-
139
-
140
-
141
-
142
-
143
-
144
-
145
-
146
-
147
-
148
-
149
-
150
-
151
-
152
-
153
-
154
-
155
-
156
-
157
-
158
-
159
-
160
-
161
-
162
-
163
-
164
-
165
-
166
-
167
-
168
-
169
-
170
-
171
-
172
-
173
-
174
-
175
-
176
-
177
-
178
-
179
-
180
-
181
-
182
-
183
-
184
-
185
-
186
-
187
-
188
-
189
-
190
-
191
-
192
-
193
-
194
-
195
-
196
-
197
-
198
-
199
-
200
-
201
-
202
-
203
-
204
-
205
-
206
-
207
-
208
-
209
-
210
-
211
-
212
-
213
-
214
-
215
-
216
-
217
-
218
-
219
-
220
-
221
-
222
-
223
-
224
-
225
-
226
-
227
-
228
 |
 |

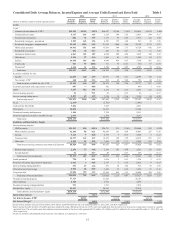
37
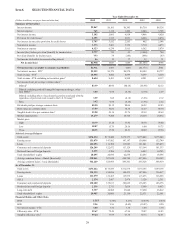
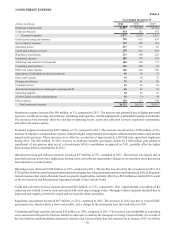
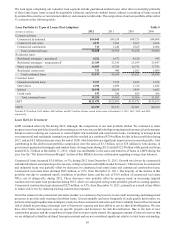
Consolidated Daily Average Balances, Income/Expense and Average Yields Earned and Rates Paid Table 1
2012 2011 2010
(Dollars in millions; yields on taxable-equivalent basis)
Average
Balances Income/
Expense Yields/
Rates Average
Balances
Income/
Expense
Yields/
Rates
Average
Balances
Income/
Expense
Yields/
Rates
Assets
Loans:1
Commercial and industrial - FTE 2$51,228 $2,329 4.55% $46,027 $2,368 5.14% $36,495 $1,970 5.40%
Commercial real estate 4,517 165 3.65 5,323 198 3.72 13,033 544 4.17
Commercial construction 816 31 3.79 1,173 45 3.85 3,315 122 3.68
Residential mortgages - guaranteed 5,589 165 2.96 4,587 157 3.42 932 30 3.26
Residential mortgages - nonguaranteed 22,621 1,023 4.52 21,926 1,088 4.96 25,342 1,335 5.27
Home equity products 14,962 551 3.68 15,841 594 3.75 16,728 642 3.84
Residential construction 692 36 5.17 862 45 5.21 194 11 5.47
Guaranteed student loans 6,863 265 3.87 4,920 209 4.26 3,418 140 4.10
Other direct 2,226 97 4.34 1,868 89 4.75 1,585 82 5.17
Indirect 10,468 403 3.85 9,690 439 4.53 7,530 423 5.62
Credit cards 567 57 10.06 511 59 11.61 566 67 11.75
Nonaccrual32,344 31 1.32 3,580 34 0.95 4,787 39 0.81
Total loans 122,893 5,153 4.19 116,308 5,325 4.58 113,925 5,405 4.74
Securities available for sale:
Taxable 21,875 640 2.93 23,973 770 3.21 24,994 785 3.14
Tax-exempt - FTE2368 20 5.33 502 28 5.48 783 42 5.34
Total securities available for sale - FTE 22,243 660 2.97 24,475 798 3.26 25,777 827 3.21
Securities purchased under agreements to resell 897 — 0.04 992 — — 969 1 0.08
LHFS 3,267 112 3.41 2,255 93 4.13 3,295 136 4.14
Interest-bearing deposits 22 — 0.21 22 — 0.15 26 — 0.17
Interest earning trading assets 4,157 65 1.55 3,750 79 2.10 3,195 90 2.79
Total earning assets4153,479 5,990 3.90 147,802 6,295 4.26 147,187 6,459 4.39
ALLL (2,295) (2,702)(3,045)
Cash and due from banks 5,482 5,203 4,821
Other assets 14,854 16,831 18,268
Noninterest earning trading assets 2,184 2,708 2,913
Unrealized gains on securities available for sale 2,430 2,598 2,231
Total assets $176,134 $172,440 $172,375
Liabilities and Shareholders’ Equity
Interest-bearing deposits:
NOW accounts $25,155 $23 0.09% $24,751 $35 0.14% $24,668 $58 0.24%
Money market accounts 42,101 88 0.21 42,854 161 0.38 38,893 227 0.58
Savings 5,113 5 0.10 4,535 7 0.15 4,028 9 0.22
Consumer time 10,597 145 1.37 12,451 198 1.59 14,232 267 1.87
Other time 5,954 91 1.52 7,036 122 1.73 9,205 189 2.05
Total interest-bearing consumer and commercial deposits 88,920 352 0.40 91,627 523 0.57 91,026 750 0.82
Brokered time deposits 2,204 77 3.42 2,306 101 4.38 2,561 110 4.29
Foreign deposits 51 — 0.17 80 — 0.57 355 — 0.13
Total interest-bearing deposits 91,175 429 0.47 94,013 624 0.66 93,942 860 0.92
Funds purchased 798 1 0.11 1,038 2 0.13 1,226 2 0.19
Securities sold under agreements to repurchase 1,602 3 0.18 2,157 3 0.15 2,416 4 0.15
Interest-bearing trading liabilities 676 15 2.24 851 26 3.04 833 30 3.58
Other short-term borrowings 6,952 18 0.27 3,465 12 0.36 3,014 13 0.43
Long-term debt 11,806 299 2.53 13,496 449 3.33 16,096 580 3.60
Total interest-bearing liabilities 113,009 765 0.68 115,020 1,116 0.97 117,527 1,489 1.27
Noninterest-bearing deposits 37,329 31,045 26,103
Other liabilities 4,348 3,972 4,097
Noninterest-bearing trading liabilities 953 1,707 1,814
Shareholders’ equity 20,495 20,696 22,834
Total liabilities and shareholders’ equity $176,134 $172,440 $172,375
Interest Rate Spread 3.22% 3.29% 3.12%
Net Interest Income - FTE4$5,225 $5,179 $4,970
Net Interest Margin53.40% 3.50% 3.38%
1Interest income includes loan fees of $112 million, $138 million, and $146 million for the years ended December 31, 2012, 2011, and 2010, respectively.
2Interest income includes the effects of taxable-equivalent adjustments using a federal income tax rate of 35% and, where applicable, state income taxes to increase tax-exempt interest income to a taxable-
equivalent basis. The net taxable-equivalent adjustment amounts included in the above table aggregated $123 million, $114 million, and $116 million for the years ended December 31, 2012, 2011, and
2010, respectively.
3Income on consumer and residential nonaccrual loans, if recognized, is recognized on a cash basis.