SunTrust 2012 Annual Report Download - page 210
Download and view the complete annual report
Please find page 210 of the 2012 SunTrust annual report below. You can navigate through the pages in the report by either clicking on the pages listed below, or by using the keyword search tool below to find specific information within the annual report.-
 1
1 -
2
-
3
-
4
-
5
-
6
-
7
-
8
-
9
-
10
-
11
-
12
-
13
-
14
-
15
-
16
-
17
-
18
-
19
-
20
-
21
-
22
-
23
-
24
-
25
-
26
-
27
-
28
-
29
-
30
-
31
-
32
-
33
-
34
-
35
-
36
-
37
-
38
-
39
-
40
-
41
-
42
-
43
-
44
-
45
-
46
-
47
-
48
-
49
-
50
-
51
-
52
-
53
-
54
-
55
-
56
-
57
-
58
-
59
-
60
-
61
-
62
-
63
-
64
-
65
-
66
-
67
-
68
-
69
-
70
-
71
-
72
-
73
-
74
-
75
-
76
-
77
-
78
-
79
-
80
-
81
-
82
-
83
-
84
-
85
-
86
-
87
-
88
-
89
-
90
-
91
-
92
-
93
-
94
-
95
-
96
-
97
-
98
-
99
-
100
-
101
-
102
-
103
-
104
-
105
-
106
-
107
-
108
-
109
-
110
-
111
-
112
-
113
-
114
-
115
-
116
-
117
-
118
-
119
-
120
-
121
-
122
-
123
-
124
-
125
-
126
-
127
-
128
-
129
-
130
-
131
-
132
-
133
-
134
-
135
-
136
-
137
-
138
-
139
-
140
-
141
-
142
-
143
-
144
-
145
-
146
-
147
-
148
-
149
-
150
-
151
-
152
-
153
-
154
-
155
-
156
-
157
-
158
-
159
-
160
-
161
-
162
-
163
-
164
-
165
-
166
-
167
-
168
-
169
-
170
-
171
-
172
-
173
-
174
-
175
-
176
-
177
-
178
-
179
-
180
-
181
-
182
-
183
-
184
-
185
-
186
-
187
-
188
-
189
-
190
-
191
-
192
-
193
-
194
-
195
-
196
-
197
-
198
-
199
-
 200
200 -
 201
201 -
 202
202 -
 203
203 -
 204
204 -
 205
205 -
 206
206 -
 207
207 -
 208
208 -
 209
209 -
 210
210 -
 211
211 -
 212
212 -
 213
213 -
 214
214 -
 215
215 -
 216
216 -
 217
217 -
 218
218 -
 219
219 -
 220
220 -
221
-
222
-
223
-
224
-
225
-
226
-
227
-
228
 |
 |

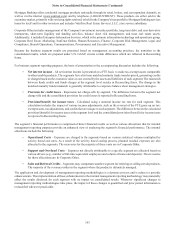
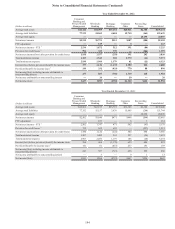
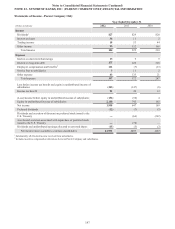
Notes to Consolidated Financial Statements (Continued)
194
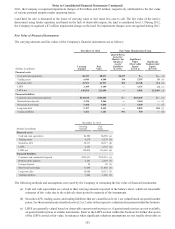
Year Ended December 31, 2012
(Dollars in millions)
Consumer
Banking and
Private Wealth
Management
Wholesale
Banking
Mortgage
Banking
Corporate
Other
Reconciling
Items Consolidated
Average total assets $46,126 $64,499 $35,154 $28,011 $2,344 $176,134
Average total liabilities 77,539 54,069 4,484 19,710 (163) 155,639
Average total equity — — — — 20,495 20,495
Net interest income $2,534 $1,753 $512 $387 ($84) $5,102
FTE adjustment — 119 — 4 — 123
Net interest income - FTE 12,534 1,872 512 391 (84) 5,225
Provision for credit losses 2596 315 770 — (286) 1,395
Net interest income/(loss) after provision for credit losses 1,938 1,557 (258) 391 202 3,830
Total noninterest income 1,369 1,543 502 1,970 (11) 5,373
Total noninterest expense 2,930 1,964 1,379 61 (11) 6,323
Income/(loss) before provision/(benefit) for income taxes 377 1,136 (1,135) 2,300 202 2,880
Provision/(benefit) for income taxes 3140 331 (433) 770 88 896
Net income/(loss) including income attributable to
noncontrolling interest 237 805 (702) 1,530 114 1,984
Net income attributable to noncontrolling interest — 16 — 10 — 26
Net income/(loss) $237 $789 ($702) $1,520 $114 $1,958
Year Ended December 31, 2011
(Dollars in millions)
Consumer
Banking and
Private Wealth
Management
Wholesale
Banking
Mortgage
Banking
Corporate
Other
Reconciling
Items Consolidated
Average total assets $43,901 $62,155 $33,719 $31,363 $1,302 $172,440
Average total liabilities 77,352 55,157 3,838 15,605 (208) 151,744
Average total equity — — — — 20,696 20,696
Net interest income $2,502 $1,640 $471 $496 ($44) $5,065
FTE adjustment — 107 — 6 1 114
Net interest income - FTE 12,502 1,747 471 502 (43) 5,179
Provision for credit losses 2722 625 693 — (527) 1,513
Net interest income/(loss) after provision for credit losses 1,780 1,122 (222) 502 484 3,666
Total noninterest income 1,507 1,402 241 297 (26) 3,421
Total noninterest expense 2,903 2,056 1,197 106 (28) 6,234
Income/(loss) before provision/(benefit) for income taxes 384 468 (1,178) 693 486 853
Provision/(benefit) for income taxes 3141 81 (457) 237 191 193
Net income/(loss) including income attributable to
noncontrolling interest 243 387 (721) 456 295 660
Net income attributable to noncontrolling interest — 3 — 9 1 13
Net income/(loss) $243 $384 ($721) $447 $294 $647