SunTrust 2012 Annual Report Download - page 73
Download and view the complete annual report
Please find page 73 of the 2012 SunTrust annual report below. You can navigate through the pages in the report by either clicking on the pages listed below, or by using the keyword search tool below to find specific information within the annual report.-
 1
1 -
2
-
3
-
4
-
5
-
6
-
7
-
8
-
9
-
10
-
11
-
12
-
13
-
14
-
15
-
16
-
17
-
18
-
19
-
20
-
21
-
22
-
23
-
24
-
25
-
26
-
27
-
28
-
29
-
30
-
31
-
32
-
33
-
34
-
35
-
36
-
37
-
38
-
39
-
40
-
41
-
42
-
43
-
44
-
45
-
46
-
47
-
48
-
49
-
50
-
51
-
52
-
53
-
54
-
55
-
56
-
57
-
58
-
59
-
60
-
61
-
62
-
 63
63 -
 64
64 -
 65
65 -
 66
66 -
 67
67 -
 68
68 -
 69
69 -
 70
70 -
 71
71 -
 72
72 -
 73
73 -
 74
74 -
 75
75 -
 76
76 -
 77
77 -
 78
78 -
 79
79 -
 80
80 -
 81
81 -
 82
82 -
 83
83 -
84
-
85
-
86
-
87
-
88
-
89
-
90
-
91
-
92
-
93
-
94
-
95
-
96
-
97
-
98
-
99
-
100
-
101
-
102
-
103
-
104
-
105
-
106
-
107
-
108
-
109
-
110
-
111
-
112
-
113
-
114
-
115
-
116
-
117
-
118
-
119
-
120
-
121
-
122
-
123
-
124
-
125
-
126
-
127
-
128
-
129
-
130
-
131
-
132
-
133
-
134
-
135
-
136
-
137
-
138
-
139
-
140
-
141
-
142
-
143
-
144
-
145
-
146
-
147
-
148
-
149
-
150
-
151
-
152
-
153
-
154
-
155
-
156
-
157
-
158
-
159
-
160
-
161
-
162
-
163
-
164
-
165
-
166
-
167
-
168
-
169
-
170
-
171
-
172
-
173
-
174
-
175
-
176
-
177
-
178
-
179
-
180
-
181
-
182
-
183
-
184
-
185
-
186
-
187
-
188
-
189
-
190
-
191
-
192
-
193
-
194
-
195
-
196
-
197
-
198
-
199
-
200
-
201
-
202
-
203
-
204
-
205
-
206
-
207
-
208
-
209
-
210
-
211
-
212
-
213
-
214
-
215
-
216
-
217
-
218
-
219
-
220
-
221
-
222
-
223
-
224
-
225
-
226
-
227
-
228
 |
 |

57
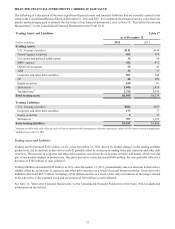
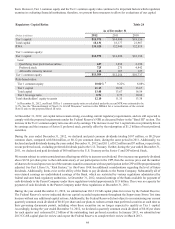
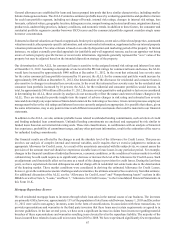
SELECTED FINANCIAL INSTRUMENTS CARRIED AT FAIR VALUE
The following is a discussion of the more significant financial assets and financial liabilities that are currently carried at fair
value on the Consolidated Balance Sheets at December 31, 2012 and 2011. For a complete discussion of our fair value elections
and the methodologies used to estimate the fair values of our financial instruments, refer to Note 18, “Fair Value Election and
Measurement,” to the Consolidated Financial Statements in this Form 10-K.
Trading Assets and Liabilities Table 17
As of December 31
(Dollars in millions) 2012 2011
Trading Assets:
U.S. Treasury securities $111 $144
Federal agency securities 462 478
U.S. states and political subdivisions 34 54
MBS - agency 432 412
CDO/CLO securities 55 45
ABS 36 37
Corporate and other debt securities 567 345
CP 28 229
Equity securities 100 91
Derivatives 11,905 2,414
Trading loans 22,319 2,030
Total trading assets $6,049 $6,279
Trading Liabilities:
U.S. Treasury securities $582 $569
Corporate and other debt securities 173 77
Equity securities 937
Derivatives 1397 1,123
Total trading liabilities $1,161 $1,806
1 Amounts are offset with cash collateral received from or deposited with counterparties when the contracts are subject to ISDA master netting arrangements.
2 Includes loans related to TRS.
Trading Assets and Liabilities
Trading assets decreased $230 million, or 4%, since December 31, 2011, driven by normal changes in the trading portfolio
product mix, led by declines in derivatives and CP, partially offset by increases in trading loans and corporate and other debt
securities. The increase in corporate and other debt securities was driven by an increase in high yield bonds, which was also
part of our normal changes in product mix. Our gross derivative assets decreased $809 million, but were partially offset by a
decrease of $300 million in cash collateral.
Trading liabilities decreased $645 million, or 36%, since December 31, 2011, predominantly due to a decrease in derivatives,
slightly offset by an increase in corporate and other debt securities as a result of normal business activity. Gross derivative
liabilities decreased $637 million, including a $189 million decline as a result of the early termination of the hedges related
to the sale of the Coke common stock and an increase of $89 million in cash collateral.
See Note 16, "Derivative Financial Instruments," to the Consolidated Financial Statements in this Form 10-K for additional
information on derivatives.