SunTrust 2012 Annual Report Download - page 215
Download and view the complete annual report
Please find page 215 of the 2012 SunTrust annual report below. You can navigate through the pages in the report by either clicking on the pages listed below, or by using the keyword search tool below to find specific information within the annual report.-
 1
1 -
2
-
3
-
4
-
5
-
6
-
7
-
8
-
9
-
10
-
11
-
12
-
13
-
14
-
15
-
16
-
17
-
18
-
19
-
20
-
21
-
22
-
23
-
24
-
25
-
26
-
27
-
28
-
29
-
30
-
31
-
32
-
33
-
34
-
35
-
36
-
37
-
38
-
39
-
40
-
41
-
42
-
43
-
44
-
45
-
46
-
47
-
48
-
49
-
50
-
51
-
52
-
53
-
54
-
55
-
56
-
57
-
58
-
59
-
60
-
61
-
62
-
63
-
64
-
65
-
66
-
67
-
68
-
69
-
70
-
71
-
72
-
73
-
74
-
75
-
76
-
77
-
78
-
79
-
80
-
81
-
82
-
83
-
84
-
85
-
86
-
87
-
88
-
89
-
90
-
91
-
92
-
93
-
94
-
95
-
96
-
97
-
98
-
99
-
100
-
101
-
102
-
103
-
104
-
105
-
106
-
107
-
108
-
109
-
110
-
111
-
112
-
113
-
114
-
115
-
116
-
117
-
118
-
119
-
120
-
121
-
122
-
123
-
124
-
125
-
126
-
127
-
128
-
129
-
130
-
131
-
132
-
133
-
134
-
135
-
136
-
137
-
138
-
139
-
140
-
141
-
142
-
143
-
144
-
145
-
146
-
147
-
148
-
149
-
150
-
151
-
152
-
153
-
154
-
155
-
156
-
157
-
158
-
159
-
160
-
161
-
162
-
163
-
164
-
165
-
166
-
167
-
168
-
169
-
170
-
171
-
172
-
173
-
174
-
175
-
176
-
177
-
178
-
179
-
180
-
181
-
182
-
183
-
184
-
185
-
186
-
187
-
188
-
189
-
190
-
191
-
192
-
193
-
194
-
195
-
196
-
197
-
198
-
199
-
200
-
201
-
202
-
203
-
204
-
 205
205 -
 206
206 -
 207
207 -
 208
208 -
 209
209 -
 210
210 -
 211
211 -
 212
212 -
 213
213 -
 214
214 -
 215
215 -
 216
216 -
 217
217 -
 218
218 -
 219
219 -
 220
220 -
 221
221 -
 222
222 -
 223
223 -
 224
224 -
 225
225 -
226
-
227
-
228
 |
 |

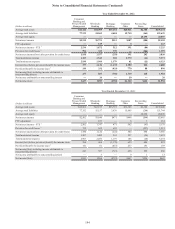
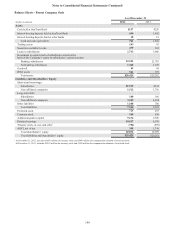
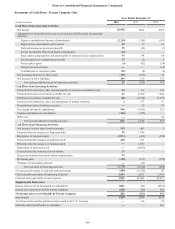
Notes to Consolidated Financial Statements (Continued)
199
Statements of Cash Flows - Parent Company Only
Year Ended December 31
(Dollars in millions) 2012 2011 2010
Cash Flows from Operating Activities:
Net income $1,958 $647 $189
Adjustments to reconcile net income to net cash provided by/(used in) operating
activities:
Equity in undistributed income of subsidiaries (2,110) (745) (185)
Depreciation, amortization and accretion 10 17 15
Deferred income tax provision/(benefit) 18 (56) (7)
Excess tax benefits from stock-based compensation (11) — —
Stock option compensation and amortization of restricted stock compensation 35 44 66
Net loss/(gain) on extinguishment of debt 15 (3) 1
Net securities gains (6) (92) (38)
Net gain on sale of assets —— (18)
Contributions to retirement plans (26) (8) (8)
Net (increase)/decrease in other assets (190) (192) 38
Net increase in other liabilities 369 130 123
Net cash provided by/(used in) operating activities 62 (258) 176
Cash Flows from Investing Activities:
Proceeds from maturities, calls, and repayments of securities available for sale 65 61 164
Proceeds from sales of securities available for sale 47 6,700 7,664
Purchases of securities available for sale (68) (2,374) (7,737)
Proceeds from maturities, calls, and repayments of trading securities 2137 97
Proceeds from sales of trading securities —75 79
Net change in loans to subsidiaries 940 (3,185) 221
Capital contributions to subsidiaries (150) (250) —
Other, net —— 22
Net cash provided by investing activities 836 1,164 510
Cash Flows from Financing Activities:
Net increase in other short-term borrowings 935 463 5
Proceeds from the issuance of long-term debt 15 1,749 —
Repayment of long-term debt (3,073) (482) (350)
Proceeds from the issuance of preferred stock 438 103 —
Proceeds from the issuance of common stock —1,017 —
Repurchase of preferred stock —(4,850) —
Proceeds from the exercise of stock options 15 — —
Excess tax benefits from stock option compensation 11 — —
Dividends paid (119) (131) (259)
Purchase of outstanding warrants —(11) —
Net cash used in financing activities (1,778) (2,142) (604)
Net (decrease)/increase in cash and cash equivalents (880) (1,236) 82
Cash and cash equivalents at beginning of period 1,641 2,877 2,795
Cash and cash equivalents at end of period $761 $1,641 $2,877
Supplemental Disclosures:
Income taxes received from/(paid to) subsidiaries $621 ($2) ($338)
Income taxes (paid)/received by Parent Company (605) (66) 406
Net income taxes received/(paid) by Parent Company $16 ($68) $68
Interest paid $189 $246 $233
Accretion of discount for preferred stock issued to the U.S. Treasury —80 25
Noncash capital contribution to subsidiary —— 997