SunTrust 2012 Annual Report Download - page 60
Download and view the complete annual report
Please find page 60 of the 2012 SunTrust annual report below. You can navigate through the pages in the report by either clicking on the pages listed below, or by using the keyword search tool below to find specific information within the annual report.-
 1
1 -
2
-
3
-
4
-
5
-
6
-
7
-
8
-
9
-
10
-
11
-
12
-
13
-
14
-
15
-
16
-
17
-
18
-
19
-
20
-
21
-
22
-
23
-
24
-
25
-
26
-
27
-
28
-
29
-
30
-
31
-
32
-
33
-
34
-
35
-
36
-
37
-
38
-
39
-
40
-
41
-
42
-
43
-
44
-
45
-
46
-
47
-
48
-
49
-
 50
50 -
 51
51 -
 52
52 -
 53
53 -
 54
54 -
 55
55 -
 56
56 -
 57
57 -
 58
58 -
 59
59 -
 60
60 -
 61
61 -
 62
62 -
 63
63 -
 64
64 -
 65
65 -
 66
66 -
 67
67 -
 68
68 -
 69
69 -
 70
70 -
71
-
72
-
73
-
74
-
75
-
76
-
77
-
78
-
79
-
80
-
81
-
82
-
83
-
84
-
85
-
86
-
87
-
88
-
89
-
90
-
91
-
92
-
93
-
94
-
95
-
96
-
97
-
98
-
99
-
100
-
101
-
102
-
103
-
104
-
105
-
106
-
107
-
108
-
109
-
110
-
111
-
112
-
113
-
114
-
115
-
116
-
117
-
118
-
119
-
120
-
121
-
122
-
123
-
124
-
125
-
126
-
127
-
128
-
129
-
130
-
131
-
132
-
133
-
134
-
135
-
136
-
137
-
138
-
139
-
140
-
141
-
142
-
143
-
144
-
145
-
146
-
147
-
148
-
149
-
150
-
151
-
152
-
153
-
154
-
155
-
156
-
157
-
158
-
159
-
160
-
161
-
162
-
163
-
164
-
165
-
166
-
167
-
168
-
169
-
170
-
171
-
172
-
173
-
174
-
175
-
176
-
177
-
178
-
179
-
180
-
181
-
182
-
183
-
184
-
185
-
186
-
187
-
188
-
189
-
190
-
191
-
192
-
193
-
194
-
195
-
196
-
197
-
198
-
199
-
200
-
201
-
202
-
203
-
204
-
205
-
206
-
207
-
208
-
209
-
210
-
211
-
212
-
213
-
214
-
215
-
216
-
217
-
218
-
219
-
220
-
221
-
222
-
223
-
224
-
225
-
226
-
227
-
228
 |
 |
44
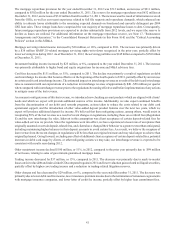
At December 31, 2012, 32% of our home equity products were in a first lien position and 68% were in a second lien position.
For home equity products in a second lien position, we service 29% of the loans that are senior to the home equity product.
Only a small percentage of home equity lines are scheduled to convert to amortizing during 2013, with 95% of home equity
line balances scheduled to convert to amortization in 2014 or later and over 56% in 2017 or later. It should be noted that a
majority of accounts historically have not converted to amortizing. Based on historical trends, within 12 months of the end
of their draw period, approximately 79% of accounts, and approximately 66% of accounts with a balance, closed or refinanced
before or soon after converting. We perform credit management activities on home equity accounts to limit our loss exposure.
These activities result in the suspension of available credit of most home equity second lien accounts when the first lien
position is delinquent, including when the second lien is still current. In 2012, we initiated the monitoring of delinquency
status of first mortgages serviced by other parties. Additionally, we actively monitor refreshed credit bureau scores of borrowers
with second liens, as these scores are highly sensitive to first lien mortgage delinquency. At December 31, 2012, our home
equity second lien loss severity was approximately 92%.
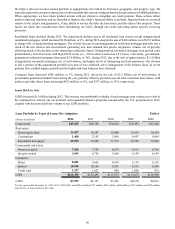
Based on guidance from our primary federal banking regulator in 2012, we elected to revise our credit policy related to the
nonaccrual status of performing second lien loans and began classifying performing home equity lines, loans, and mortgages
that are subordinate to nonaccrual first lien loans as NPLs. At December 31, 2012, $76 million of performing second lien
loans outstanding were classified as NPLs. Our methodology for calculating the ALLL considers the financial condition of
the borrower, either through the direct knowledge we have from servicing the first mortgage or through the regular refreshing
of FICO scores, which quickly respond to borrower delinquencies. Therefore, this change in policy did not have a material
impact on the ALLL.
Additionally, we implemented a change to our credit policy to recognize charge-offs of second lien home equity loans, lines,
and mortgages at 120 days past due based on a recent analysis indicating that a vast majority of these loans are ultimately
charged-off. Previously these charge-offs were recognized at 180 days past due. This change in policy resulted in $65 million
of incremental charge-offs during the third quarter of 2012 when the change in policy was adopted. During the fourth quarter
of 2012, we also changed our policy with respect to residential loans discharged in Chapter 7 bankruptcy that remained current
but have not been reaffirmed by the borrower. This change in policy was in response to recent regulatory guidance. As a result
of the policy change, we began classifying the discharged Chapter 7 loans as nonaccruing TDRs regardless of the loans' actual
payment history and expected performance and recognized $79 million in charge-offs to record the loans at the estimated fair
value of the underlying collateral. We identified and reclassified an incremental $232 million of residential real estate loans
to nonaccrual, of which $177 million were newly designated as TDRs. Additionally, $24 million in existing nonaccrual Chapter
7 loans were newly designated as TDRs. Prior to December 31, 2012, our policy was to classify loans to borrowers who had
filed for bankruptcy as nonaccrual when such loans became 60 days past due. However, we did not previously report Chapter
7 loans as TDRs unless the loans were otherwise modified under one of our loss mitigation programs.