SunTrust 2012 Annual Report Download - page 69
Download and view the complete annual report
Please find page 69 of the 2012 SunTrust annual report below. You can navigate through the pages in the report by either clicking on the pages listed below, or by using the keyword search tool below to find specific information within the annual report.-
 1
1 -
2
-
3
-
4
-
5
-
6
-
7
-
8
-
9
-
10
-
11
-
12
-
13
-
14
-
15
-
16
-
17
-
18
-
19
-
20
-
21
-
22
-
23
-
24
-
25
-
26
-
27
-
28
-
29
-
30
-
31
-
32
-
33
-
34
-
35
-
36
-
37
-
38
-
39
-
40
-
41
-
42
-
43
-
44
-
45
-
46
-
47
-
48
-
49
-
50
-
51
-
52
-
53
-
54
-
55
-
56
-
57
-
58
-
 59
59 -
 60
60 -
 61
61 -
 62
62 -
 63
63 -
 64
64 -
 65
65 -
 66
66 -
 67
67 -
 68
68 -
 69
69 -
 70
70 -
 71
71 -
 72
72 -
 73
73 -
 74
74 -
 75
75 -
 76
76 -
 77
77 -
 78
78 -
 79
79 -
80
-
81
-
82
-
83
-
84
-
85
-
86
-
87
-
88
-
89
-
90
-
91
-
92
-
93
-
94
-
95
-
96
-
97
-
98
-
99
-
100
-
101
-
102
-
103
-
104
-
105
-
106
-
107
-
108
-
109
-
110
-
111
-
112
-
113
-
114
-
115
-
116
-
117
-
118
-
119
-
120
-
121
-
122
-
123
-
124
-
125
-
126
-
127
-
128
-
129
-
130
-
131
-
132
-
133
-
134
-
135
-
136
-
137
-
138
-
139
-
140
-
141
-
142
-
143
-
144
-
145
-
146
-
147
-
148
-
149
-
150
-
151
-
152
-
153
-
154
-
155
-
156
-
157
-
158
-
159
-
160
-
161
-
162
-
163
-
164
-
165
-
166
-
167
-
168
-
169
-
170
-
171
-
172
-
173
-
174
-
175
-
176
-
177
-
178
-
179
-
180
-
181
-
182
-
183
-
184
-
185
-
186
-
187
-
188
-
189
-
190
-
191
-
192
-
193
-
194
-
195
-
196
-
197
-
198
-
199
-
200
-
201
-
202
-
203
-
204
-
205
-
206
-
207
-
208
-
209
-
210
-
211
-
212
-
213
-
214
-
215
-
216
-
217
-
218
-
219
-
220
-
221
-
222
-
223
-
224
-
225
-
226
-
227
-
228
 |
 |

53
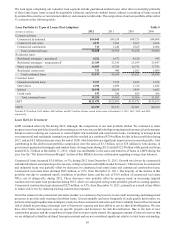
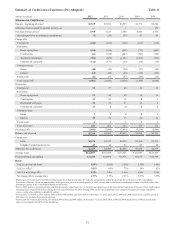
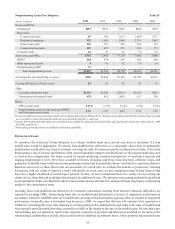
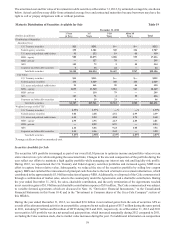
The following table presents our nonperforming assets (post-adoption):
Table 14
(Dollars in millions) 2012 2011 2010 2009
Nonaccrual/NPLs:
Commercial loans
Commercial & industrial $194 $348 $584 $732
Commercial real estate 66 288 342 191
Commercial construction 34 290 961 1,247
Total commercial NPLs 294 926 1,887 2,170
Residential loans
Residential mortgages - nonguaranteed 775 1,392 1,543 2,283
Home equity products 341 338 355 367
Residential construction 112 220 290 529
Total residential NPLs 1,228 1,950 2,188 3,179
Consumer loans
Other direct 67 10 8
Indirect 19 20 25 45
Total consumer NPLs 25 27 35 53
Total nonaccrual/NPLs 1,547 2,903 4,110 5,402
OREO1264 479 596 620
Other repossessed assets 910 52 79
Nonperforming LHFS 37 ———
Total nonperforming assets $1,857 $3,392 $4,758 $6,101
Accruing loans past due 90 days or more3$782 $2,028 $1,565 $1,500
Accruing LHFS past due 90 days or more 1322
TDRs:
Accruing restructured loans $2,501 $2,820 $2,613 $1,641
Nonaccruing restructured loans2639 802 1,005 913
Ratios:
NPLs to total loans 1.27% 2.37% 3.54% 4.75%
Nonperforming assets to total loans plus OREO,
other repossessed assets, and nonperforming LHFS 1.52 2.76 4.08 5.33
1 Does not include foreclosed real estate related to loans insured by the FHA or the VA. Proceeds due from the FHA and the VA are recorded as a receivable in other
assets until the funds are received and the property is conveyed. The receivable amount related to proceeds due from FHA or the VA totaled $140 million, $132
million, $195 million, and $113 million at December 31, 2012, 2011, 2010, and 2009, respectively.
2 Nonaccruing restructured loans are included in total nonaccrual/NPLs.
3 Includes $979 million of consolidated loans eligible for repurchase from Ginnie Mae and classified as held for sale at December 31, 2009.
Nonperforming assets decreased $1.5 billion, or 45%, during 2012. Overall, the decrease was attributed to a $1.4 billion, or
47%, decline in NPLs noted across all loan classes, largely driven by a decline in residential mortgage NPLs of $722 million,
or 37%, and a reduction of total commercial NPLs of $632 million, or 68%. The reduction in NPLs has been driven by
intentionally reducing our higher-risk loan balances, including the sale of $647 million of residential mortgage and commercial
real estate NPLs, net of $226 million in charge-offs, during 2012. Partially offsetting the decrease in NPLs related to loan
resolution and sales was the reclassification of $232 million of loans discharged in Chapter 7 bankruptcy to NPLs due to a
policy change and $76 million of NPLs as a result of a policy change to classify as NPLs performing second lien loans that
are subordinate to nonaccrual first lien loans. We elected to make the bankruptcy policy change in order to align our accounting
with others in the industry who are adopting this treatment as a result of guidance issued by the OCC. Additionally, the decision
to transfer performing second lien loans subordinate to nonaccrual first lien loans to NPLs was driven by interagency regulatory
guidance issued during 2012. At December 31, 2012, our ratio of nonperforming loans to total loans was 1.27%, down from
2.37% at December 31, 2011.
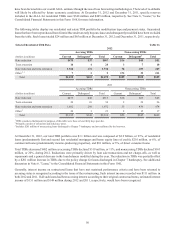
Real estate related loans comprise a significant portion of our overall nonperforming assets as a result of the condition of the
U.S. housing market. The amount of time necessary to obtain control of residential real estate collateral in certain states,
primarily Florida, has remained elevated due to delays in the foreclosure process. These delays may continue to impact the
resolution of real estate related loans within the nonperforming assets portfolio.