SunTrust 2012 Annual Report Download - page 108
Download and view the complete annual report
Please find page 108 of the 2012 SunTrust annual report below. You can navigate through the pages in the report by either clicking on the pages listed below, or by using the keyword search tool below to find specific information within the annual report.-
 1
1 -
2
-
3
-
4
-
5
-
6
-
7
-
8
-
9
-
10
-
11
-
12
-
13
-
14
-
15
-
16
-
17
-
18
-
19
-
20
-
21
-
22
-
23
-
24
-
25
-
26
-
27
-
28
-
29
-
30
-
31
-
32
-
33
-
34
-
35
-
36
-
37
-
38
-
39
-
40
-
41
-
42
-
43
-
44
-
45
-
46
-
47
-
48
-
49
-
50
-
51
-
52
-
53
-
54
-
55
-
56
-
57
-
58
-
59
-
60
-
61
-
62
-
63
-
64
-
65
-
66
-
67
-
68
-
69
-
70
-
71
-
72
-
73
-
74
-
75
-
76
-
77
-
78
-
79
-
80
-
81
-
82
-
83
-
84
-
85
-
86
-
87
-
88
-
89
-
90
-
91
-
92
-
93
-
94
-
95
-
96
-
97
-
 98
98 -
 99
99 -
 100
100 -
 101
101 -
 102
102 -
 103
103 -
 104
104 -
 105
105 -
 106
106 -
 107
107 -
 108
108 -
 109
109 -
 110
110 -
 111
111 -
 112
112 -
 113
113 -
 114
114 -
 115
115 -
 116
116 -
 117
117 -
 118
118 -
119
-
120
-
121
-
122
-
123
-
124
-
125
-
126
-
127
-
128
-
129
-
130
-
131
-
132
-
133
-
134
-
135
-
136
-
137
-
138
-
139
-
140
-
141
-
142
-
143
-
144
-
145
-
146
-
147
-
148
-
149
-
150
-
151
-
152
-
153
-
154
-
155
-
156
-
157
-
158
-
159
-
160
-
161
-
162
-
163
-
164
-
165
-
166
-
167
-
168
-
169
-
170
-
171
-
172
-
173
-
174
-
175
-
176
-
177
-
178
-
179
-
180
-
181
-
182
-
183
-
184
-
185
-
186
-
187
-
188
-
189
-
190
-
191
-
192
-
193
-
194
-
195
-
196
-
197
-
198
-
199
-
200
-
201
-
202
-
203
-
204
-
205
-
206
-
207
-
208
-
209
-
210
-
211
-
212
-
213
-
214
-
215
-
216
-
217
-
218
-
219
-
220
-
221
-
222
-
223
-
224
-
225
-
226
-
227
-
228
 |
 |
92
effective beginning in the fourth quarter of 2011, and service charges on deposit accounts, partially offset by increased leasing
gains.
Total noninterest expense was $2.1 billion, an increase of $115 million, or 6%, compared to the prior year. The increase was
predominantly due to higher operating losses tied to litigation accruals, staff expense, and allocated costs, partially offset by
declines in collection services and other real estate expense.
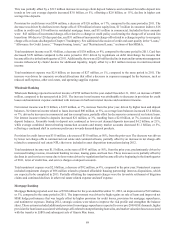
Mortgage Banking
Mortgage Banking reported a net loss of $721 million for the year ended December 31, 2011, an improvement of $91 million,
or 11%, compared to the same period in 2010. The improvement was driven by lower provision for credit losses, partially
offset by lower mortgage production income and MSR net hedge performance, and higher expenses.
Net interest income was $471 million, an increase of $33 million, or 8%, over the prior year. The increase was predominantly
due to higher net interest income on loans, which increased $55 million, due to improved spreads. Total average loans, primarily
residential mortgages, were relatively consistent with prior year, increasing $85 million. The improvement in net interest
income on loans was partially offset by lower income on LHFS, which declined $31 million due primarily to lower volumes.
Provision for credit losses was $693 million, a decrease of $494 million, or 42%, from the same period in 2010. The decline
was driven by a $404 million decline in residential mortgage net charge-offs. Net charge-offs included $10 million and $51
million of charge-offs related to NPL sales in 2011 and 2010, respectively.
Noninterest income was $241 million, down $280 million, or 54%, from 2010. Total mortgage production income for the year
was a loss of $19 million, down $133 million from the prior year as loan production volume of $23.1 billion was down $6.2
billion, or 21%, from the prior year resulting in lower gain on sale and fee income. Mortgage loan repurchase provision was
up $46 million over the prior year due to higher agency-related repurchase requests.
Mortgage servicing income was down $134 million, or 37%, compared to 2010 due to less favorable net hedge performance,
which was negatively impacted by $38 million due to an increase in prepayment assumptions attributable to anticipated
refinancing activity arising from the HARP 2.0 program. Total loans serviced at December 31, 2011 were $157.8 billion
compared with $167.2 billion the prior year, down 6%.
Total noninterest expense was $1.2 billion, an increase of $116 million, or 11%. The predominant drivers of the higher expense
were regulatory compliance, operating losses related to mortgage servicing, and collection costs, partially offset by certain
lower volume-related expenses and lower other real estate expenses.
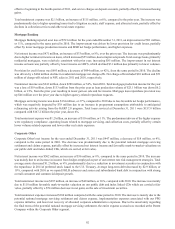
Corporate Other
Corporate Other's net income for the year ended December 31, 2011 was $447 million, a decrease of $18 million, or 4%,
compared to the same period in 2010. The decrease was predominantly due to the potential national mortgage servicing
settlement and claims expense, partially offset by increased net interest income and favorable mark-to-market valuations on
our public debt and index-linked CDs, which are carried at fair value.
Net interest income was $502 million, an increase of $36 million, or 8%, compared to the same period in 2010. The increase
was mainly due to an increase in income from hedges employed as part of our interest rate risk management strategies. Total
average assets decreased $1.2 billion, or 4%, predominantly due to a reduction in investment securities in conjunction with
the repurchase in 2011of preferred stock issued to the U.S. Treasury. Average long-term debt decreased by $2.9 billion, or
19%, compared with 2010 as we repaid FHLB advances and senior and subordinated bank debt in conjunction with strong
overall consumer and commercial deposit growth.
Total noninterest income was $297 million, an increase of $40 million, or 16%, compared with 2010. The increase was mainly
due to $118 million favorable mark-to-market valuation on our public debt and index linked CDs which are carried at fair
value, partially offset by a $74 million decrease in net gains on the sale of investment securities.
Total noninterest expenses increased $104 million compared with the same period in 2010. The increase is mainly due to the
potential national mortgage servicing settlement and claims expense, implementation expenses associated with our PPG
expense initiative, and lower net recovery of allocated corporate administrative expenses. Due to the uncertainty regarding
the final terms of the potential national mortgage servicing settlement, the entire expense accrual was recorded at the Parent
Company within the Corporate Other segment.