SunTrust 2012 Annual Report Download - page 186
Download and view the complete annual report
Please find page 186 of the 2012 SunTrust annual report below. You can navigate through the pages in the report by either clicking on the pages listed below, or by using the keyword search tool below to find specific information within the annual report.-
 1
1 -
2
-
3
-
4
-
5
-
6
-
7
-
8
-
9
-
10
-
11
-
12
-
13
-
14
-
15
-
16
-
17
-
18
-
19
-
20
-
21
-
22
-
23
-
24
-
25
-
26
-
27
-
28
-
29
-
30
-
31
-
32
-
33
-
34
-
35
-
36
-
37
-
38
-
39
-
40
-
41
-
42
-
43
-
44
-
45
-
46
-
47
-
48
-
49
-
50
-
51
-
52
-
53
-
54
-
55
-
56
-
57
-
58
-
59
-
60
-
61
-
62
-
63
-
64
-
65
-
66
-
67
-
68
-
69
-
70
-
71
-
72
-
73
-
74
-
75
-
76
-
77
-
78
-
79
-
80
-
81
-
82
-
83
-
84
-
85
-
86
-
87
-
88
-
89
-
90
-
91
-
92
-
93
-
94
-
95
-
96
-
97
-
98
-
99
-
100
-
101
-
102
-
103
-
104
-
105
-
106
-
107
-
108
-
109
-
110
-
111
-
112
-
113
-
114
-
115
-
116
-
117
-
118
-
119
-
120
-
121
-
122
-
123
-
124
-
125
-
126
-
127
-
128
-
129
-
130
-
131
-
132
-
133
-
134
-
135
-
136
-
137
-
138
-
139
-
140
-
141
-
142
-
143
-
144
-
145
-
146
-
147
-
148
-
149
-
150
-
151
-
152
-
153
-
154
-
155
-
156
-
157
-
158
-
159
-
160
-
161
-
162
-
163
-
164
-
165
-
166
-
167
-
168
-
169
-
170
-
171
-
172
-
173
-
174
-
175
-
 176
176 -
 177
177 -
 178
178 -
 179
179 -
 180
180 -
 181
181 -
 182
182 -
 183
183 -
 184
184 -
 185
185 -
 186
186 -
 187
187 -
 188
188 -
 189
189 -
 190
190 -
 191
191 -
 192
192 -
 193
193 -
 194
194 -
 195
195 -
 196
196 -
197
-
198
-
199
-
200
-
201
-
202
-
203
-
204
-
205
-
206
-
207
-
208
-
209
-
210
-
211
-
212
-
213
-
214
-
215
-
216
-
217
-
218
-
219
-
220
-
221
-
222
-
223
-
224
-
225
-
226
-
227
-
228
 |
 |
Notes to Consolidated Financial Statements (Continued)
170
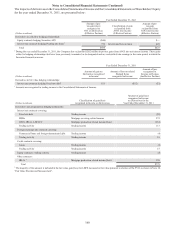
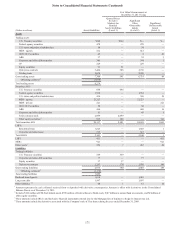
Recurring Fair Value Measurements
The following tables present certain information regarding assets and liabilities measured at fair value on a recurring basis
and the changes in fair value for those specific financial instruments in which fair value has been elected.
Fair Value Measurements at
December 31, 2012 Using
(Dollars in millions) Assets/Liabilities
Quoted Prices In
Active
Markets for
Identical
Assets/Liabilities
(Level 1)
Significant
Other
Observable
Inputs
(Level 2)
Significant
Unobservable
Inputs
(Level 3)
Assets
Trading assets:
U.S. Treasury securities $111 $111 $— $—
Federal agency securities 462 — 462 —
U.S. states and political subdivisions 34 — 34 —
MBS - agency 432 — 432 —
CDO/CLO securities 55 — 3 52
ABS 36 — 31 5
Corporate and other debt securities 567 — 566 1
CP 28 — 28 —
Equity securities 100 100 — —
Derivative contracts 2,635 183 2,452 —
Trading loans 2,319 — 2,319 —
Gross trading assets 6,779 394 6,327 58
Offsetting collateral 1(730)
Total trading assets 6,049
Securities AFS:
U.S. Treasury securities 222 222 — —
Federal agency securities 2,069 — 2,069 —
U.S. states and political subdivisions 320 — 274 46
MBS - agency 18,169 — 18,169 —
MBS - private 209 — — 209
ABS 216 — 195 21
Corporate and other debt securities 46 — 41 5
Other equity securities 2702 69 — 633
Total securities AFS 21,953 291 20,748 914
LHFS:
Residential loans 2,924 — 2,916 8
Corporate and other loans 319 — 319 —
Total LHFS 3,243 — 3,235 8
LHFI 379 — — 379
MSRs 899 — — 899
Other assets 3178 2 44 132
Liabilities
Trading liabilities:
U.S. Treasury securities 582 582 — —
Corporate and other debt securities 173 — 173 —
Equity securities 9 9 — —
Derivative contracts 1,656 — 1,656 —
Gross trading liabilities 2,420 591 1,829 —
Offsetting collateral 1(1,259)
Total trading liabilities 1,161
Brokered time deposits 832 — 832 —
Long-term debt 1,622 — 1,622 —
Other liabilities 3,4 46 — 15 31
1 Amount represents the cash collateral received from or deposited with derivative counterparties. Amount is offset with derivatives in the Consolidated
Balance Sheets as of December 31, 2012.
2 Includes $229 million of FHLB of Atlanta stock, $402 million of Federal Reserve Bank stock, $69 million in mutual fund investments, and $2 million of
other equity securities.
3 These amounts include IRLCs and derivative financial instruments entered into by the Mortgage line of business to hedge its interest rate risk.
4 These amounts include the derivative associated with the Company's sale of Visa shares during the year ended December 31, 2009, certain CDS, and
contingent consideration obligations related to acquisitions.