SunTrust 2012 Annual Report Download - page 80
Download and view the complete annual report
Please find page 80 of the 2012 SunTrust annual report below. You can navigate through the pages in the report by either clicking on the pages listed below, or by using the keyword search tool below to find specific information within the annual report.-
 1
1 -
2
-
3
-
4
-
5
-
6
-
7
-
8
-
9
-
10
-
11
-
12
-
13
-
14
-
15
-
16
-
17
-
18
-
19
-
20
-
21
-
22
-
23
-
24
-
25
-
26
-
27
-
28
-
29
-
30
-
31
-
32
-
33
-
34
-
35
-
36
-
37
-
38
-
39
-
40
-
41
-
42
-
43
-
44
-
45
-
46
-
47
-
48
-
49
-
50
-
51
-
52
-
53
-
54
-
55
-
56
-
57
-
58
-
59
-
60
-
61
-
62
-
63
-
64
-
65
-
66
-
67
-
68
-
69
-
 70
70 -
 71
71 -
 72
72 -
 73
73 -
 74
74 -
 75
75 -
 76
76 -
 77
77 -
 78
78 -
 79
79 -
 80
80 -
 81
81 -
 82
82 -
 83
83 -
 84
84 -
 85
85 -
 86
86 -
 87
87 -
 88
88 -
 89
89 -
 90
90 -
91
-
92
-
93
-
94
-
95
-
96
-
97
-
98
-
99
-
100
-
101
-
102
-
103
-
104
-
105
-
106
-
107
-
108
-
109
-
110
-
111
-
112
-
113
-
114
-
115
-
116
-
117
-
118
-
119
-
120
-
121
-
122
-
123
-
124
-
125
-
126
-
127
-
128
-
129
-
130
-
131
-
132
-
133
-
134
-
135
-
136
-
137
-
138
-
139
-
140
-
141
-
142
-
143
-
144
-
145
-
146
-
147
-
148
-
149
-
150
-
151
-
152
-
153
-
154
-
155
-
156
-
157
-
158
-
159
-
160
-
161
-
162
-
163
-
164
-
165
-
166
-
167
-
168
-
169
-
170
-
171
-
172
-
173
-
174
-
175
-
176
-
177
-
178
-
179
-
180
-
181
-
182
-
183
-
184
-
185
-
186
-
187
-
188
-
189
-
190
-
191
-
192
-
193
-
194
-
195
-
196
-
197
-
198
-
199
-
200
-
201
-
202
-
203
-
204
-
205
-
206
-
207
-
208
-
209
-
210
-
211
-
212
-
213
-
214
-
215
-
216
-
217
-
218
-
219
-
220
-
221
-
222
-
223
-
224
-
225
-
226
-
227
-
228
 |
 |
64
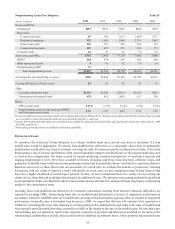
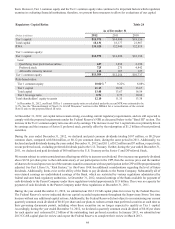
them. However, Tier 1 common equity and the Tier 1 common equity ratio continue to be important factors which regulators
examine in evaluating financial institutions; therefore, we present these measures to allow for evaluations of our capital.
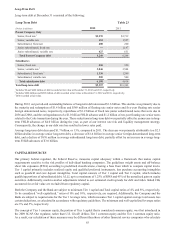
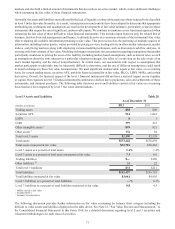
Regulatory Capital Ratios Table 24
As of December 31
(Dollars in millions) 2012 2011 2010
Tier 1 capital $14,975 $14,490 $18,156
Total capital 18,131 18,177 21,967
RWA 134,524 132,940 132,819
Tier 1 common equity:
Tier 1 capital $14,975 $14,490 $18,156
Less:
Qualifying trust preferred securities 627 1,854 2,350
Preferred stock 725 275 4,942
Allowable minority interest 114 107 127
Tier 1 common equity $13,509 $12,254 $10,737
Risk-based ratios:
Tier 1 common equity 10.04% 19.22% 8.08%
Tier 1 capital 11.13 10.90 13.67
Total capital 13.48 13.67 16.54
Tier 1 leverage ratio 8.91 8.75 10.94
Total shareholders’ equity to assets 12.10 11.35 13.38
1 At December 31, 2012, our Basel III Tier 1 common equity ratio as calculated under the recent NPR was estimated to be
8.2%. See the "Reconcilement of Non-U.S. GAAP Measures" section in this MD&A for a reconciliation of the current
Basel I ratio to the proposed Basel III ratio.
At December 31, 2012, our capital ratios remain strong, exceeding current regulatory requirements, and are still expected to
comply with the proposed requirements under the Federal Reserve's NPR as discussed below in the "Basel III" section. The
increase in the Tier 1 common equity ratio was driven by earnings. The increase in our Tier 1 capital ratio was primarily driven
by earnings and the issuance of Series E preferred stock, partially offset by the redemption of $1.2 billion of trust preferred
securities.
During the year ended December 31, 2012, we declared and paid common dividends totaling $107 million, or $0.20 per
common share, compared with $64 million, or $0.12 per common share, during the same period in 2011. Additionally, we
declared and paid dividends during the years ended December 31, 2012 and 2011, of $12 million and $7 million, respectively,
on our preferred stock, excluding preferred dividends paid to the U.S. Treasury. Further, during the year ended December 31,
2011, we declared and paid dividends of $60 million to the U.S. Treasury on the Series C and D Preferred Stock.
We remain subject to certain considerations affecting our ability to increase our dividend. If we increase our quarterly dividend
above $0.54 per share prior to the tenth anniversary of our participation in the CPP, then the exercise price and the number
of shares to be issued upon exercise of the warrants issued in connection with our participation in the CPP will be proportionately
adjusted. See Part I, Item 1A, “Risk Factors,” in this Form 10-K for additional considerations regarding the level of future
dividends. Additionally, limits exist on the ability of the Bank to pay dividends to the Parent Company. Substantially all of
our retained earnings are undistributed earnings of the Bank, which are restricted by various regulations administered by
federal and state bank regulatory authorities. At December 31, 2012, retained earnings of the Bank available for payment of
cash dividends to the Parent Company under these regulations totaled approximately $1.8 billion. There was no capacity for
payment of cash dividends to the Parent Company under these regulations at December 31, 2011.
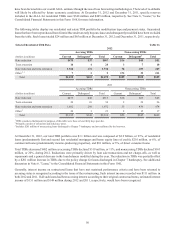
During the year ended December 31, 2012, we submitted our 2012 CCAR capital plans for review by the Federal Reserve.
The Federal Reserve's review indicated that our capital exceeded requirements throughout the Supervisory Stress Test time
horizon without any additional capital actions. Additionally, the Federal Reserve did not object to us maintaining our current
quarterly common stock dividend of $0.05 per share and our plans to redeem certain trust preferred securities at such time as
their governing documents permit, including when these securities are no longer expected to qualify as Tier 1 capital.
Accordingly, during the year ended December 31, 2012, we declared a quarterly common stock dividend of $0.05 per share
for each quarter and redeemed $1.2 billion of the outstanding trust preferred securities. In January 2013, we submitted our
2013 CCAR capital plan for review and expect the Federal Reserve to complete their review in March 2013.