SunTrust 2012 Annual Report Download - page 58
Download and view the complete annual report
Please find page 58 of the 2012 SunTrust annual report below. You can navigate through the pages in the report by either clicking on the pages listed below, or by using the keyword search tool below to find specific information within the annual report.-
 1
1 -
2
-
3
-
4
-
5
-
6
-
7
-
8
-
9
-
10
-
11
-
12
-
13
-
14
-
15
-
16
-
17
-
18
-
19
-
20
-
21
-
22
-
23
-
24
-
25
-
26
-
27
-
28
-
29
-
30
-
31
-
32
-
33
-
34
-
35
-
36
-
37
-
38
-
39
-
40
-
41
-
42
-
43
-
44
-
45
-
46
-
47
-
 48
48 -
 49
49 -
 50
50 -
 51
51 -
 52
52 -
 53
53 -
 54
54 -
 55
55 -
 56
56 -
 57
57 -
 58
58 -
 59
59 -
 60
60 -
 61
61 -
 62
62 -
 63
63 -
 64
64 -
 65
65 -
 66
66 -
 67
67 -
 68
68 -
69
-
70
-
71
-
72
-
73
-
74
-
75
-
76
-
77
-
78
-
79
-
80
-
81
-
82
-
83
-
84
-
85
-
86
-
87
-
88
-
89
-
90
-
91
-
92
-
93
-
94
-
95
-
96
-
97
-
98
-
99
-
100
-
101
-
102
-
103
-
104
-
105
-
106
-
107
-
108
-
109
-
110
-
111
-
112
-
113
-
114
-
115
-
116
-
117
-
118
-
119
-
120
-
121
-
122
-
123
-
124
-
125
-
126
-
127
-
128
-
129
-
130
-
131
-
132
-
133
-
134
-
135
-
136
-
137
-
138
-
139
-
140
-
141
-
142
-
143
-
144
-
145
-
146
-
147
-
148
-
149
-
150
-
151
-
152
-
153
-
154
-
155
-
156
-
157
-
158
-
159
-
160
-
161
-
162
-
163
-
164
-
165
-
166
-
167
-
168
-
169
-
170
-
171
-
172
-
173
-
174
-
175
-
176
-
177
-
178
-
179
-
180
-
181
-
182
-
183
-
184
-
185
-
186
-
187
-
188
-
189
-
190
-
191
-
192
-
193
-
194
-
195
-
196
-
197
-
198
-
199
-
200
-
201
-
202
-
203
-
204
-
205
-
206
-
207
-
208
-
209
-
210
-
211
-
212
-
213
-
214
-
215
-
216
-
217
-
218
-
219
-
220
-
221
-
222
-
223
-
224
-
225
-
226
-
227
-
228
 |
 |

42
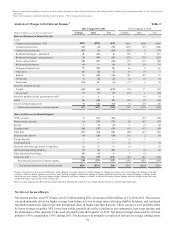
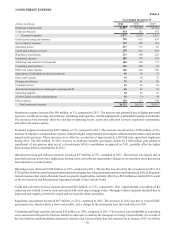
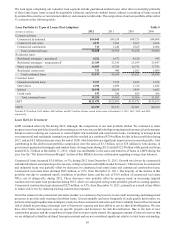
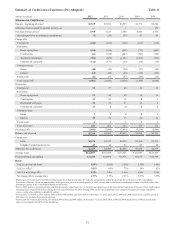
NONINTEREST EXPENSE
Table 4
Year Ended December 31
(Dollars in millions) 2012 2011 2010
Employee compensation $2,603 $2,494 $2,364
Employee benefits 474 382 457
Personnel expenses 3,077 2,876 2,821
Outside processing and software 710 653 638
Net occupancy expense 359 356 361
Operating losses 277 377 83
Credit and collection services 239 275 279
Regulatory assessments 233 300 265
Equipment expense 188 178 174
Marketing and customer development 184 184 177
Consulting and legal fees 165 120 84
Other real estate expense 140 264 300
Impairment of affordable housing investments 96 10 15
Other staff expense 94 95 55
Postage and delivery 76 81 83
Communications 63 63 64
Amortization/impairment of intangible assets/goodwill 46 43 51
Operating supplies 34 45 47
Net loss/(gain) on debt extinguishment 16 (3) 70
Other expense 326 317 344
Total noninterest expense $6,323 $6,234 $5,911
Noninterest expense increased by $89 million, or 1%, compared to 2011. The increase was primarily due to higher personnel
expenses, outside processing and software, consulting and legal fees, and the impairment of affordable housing investments.
The increases were partially offset by a decline in operating losses, credit and collection services, regulatory assessments,
and other real estate expense.
Personnel expenses increased by $201 million, or 7%, compared to 2011. The increase was driven by a $109 million, or 4%,
increase in employee compensation expense related to higher compensation from improved business performance and modest
annual merit increases. These increases were offset by a reduction of approximately 2,400 full-time equivalent employees
during 2012. The $92 million, or 24%, increase in employee benefits was largely driven by a $60 million gain related to
curtailment of our pension plan net of a discretionary 401(k) contribution recognized in 2011, partially offset by higher
discretionary 401(k) contributions in 2012.
Outside processing and software expenses increased $57 million, or 9%, compared to 2011. The increase was largely due to
increased outsourced services, application hosting costs, and software maintenance charges as we transition more processing
from internal to external parties.
Operating losses decreased $100 million, or 27%, compared to 2011. The decline was driven by the recognition in 2011 of a
$120 million liability related to the potential national mortgage servicing settlement and other declines during 2012 in litigation-
related expenses that tend to fluctuate based on specific legal matters, partially offset by a $63 million accrual in 2012 as part
of the Acceleration and Remediation Agreement related to the Consent Order.
Credit and collection services expense decreased $36 million, or 13%, compared to 2011. Approximately two-thirds of the
reduction was related to lower costs associated with servicing mortgage loans. Mortgage-related expenses declined due to
improved asset quality in both the owned and serviced-for-others portfolios.
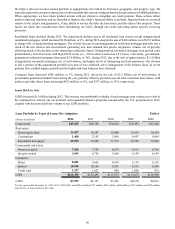
Regulatory assessments decreased $67 million, or 22%, compared to 2011. The decrease in 2012 was due to a lower FDIC
assessment rate, which reflects a lower risk profile, and a change in the assessment base that took effect in 2011.
Consulting and legal expenses increased $45 million, or 38%, compared to 2011. The increase was attributable to consulting
costs associated with specific business initiatives and costs to address the mortgage servicing Consent Order. As a result of
the Acceleration and Remediation Agreement related to the Consent Order that was entered into in January 2013, we will no