SunTrust 2012 Annual Report Download - page 5
Download and view the complete annual report
Please find page 5 of the 2012 SunTrust annual report below. You can navigate through the pages in the report by either clicking on the pages listed below, or by using the keyword search tool below to find specific information within the annual report.-
 1
1 -
 2
2 -
 3
3 -
 4
4 -
 5
5 -
 6
6 -
 7
7 -
 8
8 -
 9
9 -
 10
10 -
 11
11 -
 12
12 -
 13
13 -
 14
14 -
 15
15 -
 16
16 -
17
-
18
-
19
-
20
-
21
-
22
-
23
-
24
-
25
-
26
-
27
-
28
-
29
-
30
-
31
-
32
-
33
-
34
-
35
-
36
-
37
-
38
-
39
-
40
-
41
-
42
-
43
-
44
-
45
-
46
-
47
-
48
-
49
-
50
-
51
-
52
-
53
-
54
-
55
-
56
-
57
-
58
-
59
-
60
-
61
-
62
-
63
-
64
-
65
-
66
-
67
-
68
-
69
-
70
-
71
-
72
-
73
-
74
-
75
-
76
-
77
-
78
-
79
-
80
-
81
-
82
-
83
-
84
-
85
-
86
-
87
-
88
-
89
-
90
-
91
-
92
-
93
-
94
-
95
-
96
-
97
-
98
-
99
-
100
-
101
-
102
-
103
-
104
-
105
-
106
-
107
-
108
-
109
-
110
-
111
-
112
-
113
-
114
-
115
-
116
-
117
-
118
-
119
-
120
-
121
-
122
-
123
-
124
-
125
-
126
-
127
-
128
-
129
-
130
-
131
-
132
-
133
-
134
-
135
-
136
-
137
-
138
-
139
-
140
-
141
-
142
-
143
-
144
-
145
-
146
-
147
-
148
-
149
-
150
-
151
-
152
-
153
-
154
-
155
-
156
-
157
-
158
-
159
-
160
-
161
-
162
-
163
-
164
-
165
-
166
-
167
-
168
-
169
-
170
-
171
-
172
-
173
-
174
-
175
-
176
-
177
-
178
-
179
-
180
-
181
-
182
-
183
-
184
-
185
-
186
-
187
-
188
-
189
-
190
-
191
-
192
-
193
-
194
-
195
-
196
-
197
-
198
-
199
-
200
-
201
-
202
-
203
-
204
-
205
-
206
-
207
-
208
-
209
-
210
-
211
-
212
-
213
-
214
-
215
-
216
-
217
-
218
-
219
-
220
-
221
-
222
-
223
-
224
-
225
-
226
-
227
-
228
 |
 |
3
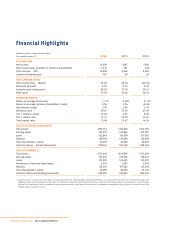
2012 Financial Highlights
• Earnings per average common diluted share of
$3.59 compared to $0.94 in 2011. 2012 earnings
included $1.40 per share from a series of
strategic actions announced in September that
improved our risk prole and strengthened
our balance sheet. Excluding these actions,
our core earnings more than doubled.
• The advantages of SunTrust’s diverse business
model were evident throughout the year. While
the low interest rate environment presented
challenges for banks to meaningfully grow net
interest income, strength in our noninterest
income led to increased overall revenue.
• Concurrently, expenses were tightly managed
and essentially stable over the prior year.
This was aided by the successful, and early,
completion of our 2011 commitment to
eliminate $300 million from our expense base.
• The multi-year improvement in our credit
metrics also continued — and in many
instances accelerated — in 2012. Most
notable was an almost 50% year-over-year
decline in nonperforming loans.
• Core lending and deposit trends were favorable
as evidenced by 6% growth in both average loans
and average lower-cost deposits.
• Lastly, capital continued to grow, and the Tier 1
common equity ratio reached an all-time high
of 10%.
The result of our proactive efforts to improve our
competitive position was apparent in the favorable
trends in our primary business segments.
Consumer Banking and Private Wealth Management
• A hallmark of SunTrust is our service quality and
the client loyalty that it garners. During 2012,
SunTrust again earned the #1 ranking in client
loyalty among retail consumers. Recognizing
that clients also value the convenience of self-
service offerings, we completed the installation
of more than 1,700 ATMs with deposit imaging
capabilities and introduced SunTrust Mobile
Deposit — both of which have resulted in
signicant increases in users and transactions.
• Core lending and deposit trends were also
favorable for this business segment; average
noninterest-bearing deposits increased 20% from
2011, and average loan balances were up 5%.