SunTrust 2012 Annual Report Download - page 54
Download and view the complete annual report
Please find page 54 of the 2012 SunTrust annual report below. You can navigate through the pages in the report by either clicking on the pages listed below, or by using the keyword search tool below to find specific information within the annual report.-
 1
1 -
2
-
3
-
4
-
5
-
6
-
7
-
8
-
9
-
10
-
11
-
12
-
13
-
14
-
15
-
16
-
17
-
18
-
19
-
20
-
21
-
22
-
23
-
24
-
25
-
26
-
27
-
28
-
29
-
30
-
31
-
32
-
33
-
34
-
35
-
36
-
37
-
38
-
39
-
40
-
41
-
42
-
43
-
 44
44 -
 45
45 -
 46
46 -
 47
47 -
 48
48 -
 49
49 -
 50
50 -
 51
51 -
 52
52 -
 53
53 -
 54
54 -
 55
55 -
 56
56 -
 57
57 -
 58
58 -
 59
59 -
 60
60 -
 61
61 -
 62
62 -
 63
63 -
 64
64 -
65
-
66
-
67
-
68
-
69
-
70
-
71
-
72
-
73
-
74
-
75
-
76
-
77
-
78
-
79
-
80
-
81
-
82
-
83
-
84
-
85
-
86
-
87
-
88
-
89
-
90
-
91
-
92
-
93
-
94
-
95
-
96
-
97
-
98
-
99
-
100
-
101
-
102
-
103
-
104
-
105
-
106
-
107
-
108
-
109
-
110
-
111
-
112
-
113
-
114
-
115
-
116
-
117
-
118
-
119
-
120
-
121
-
122
-
123
-
124
-
125
-
126
-
127
-
128
-
129
-
130
-
131
-
132
-
133
-
134
-
135
-
136
-
137
-
138
-
139
-
140
-
141
-
142
-
143
-
144
-
145
-
146
-
147
-
148
-
149
-
150
-
151
-
152
-
153
-
154
-
155
-
156
-
157
-
158
-
159
-
160
-
161
-
162
-
163
-
164
-
165
-
166
-
167
-
168
-
169
-
170
-
171
-
172
-
173
-
174
-
175
-
176
-
177
-
178
-
179
-
180
-
181
-
182
-
183
-
184
-
185
-
186
-
187
-
188
-
189
-
190
-
191
-
192
-
193
-
194
-
195
-
196
-
197
-
198
-
199
-
200
-
201
-
202
-
203
-
204
-
205
-
206
-
207
-
208
-
209
-
210
-
211
-
212
-
213
-
214
-
215
-
216
-
217
-
218
-
219
-
220
-
221
-
222
-
223
-
224
-
225
-
226
-
227
-
228
 |
 |

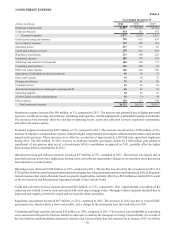
38
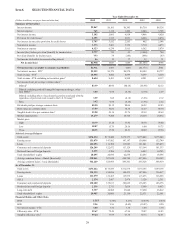
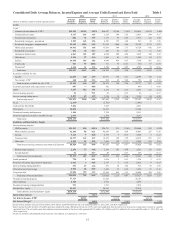
4Derivative instruments that manage our interest-sensitivity position increased net interest income $528 million, $639 million, and $617 million for the years ended December 31, 2012, 2011, and 2010,
respectively.
5The net interest margin is calculated by dividing net interest income – FTE by average total earning assets.
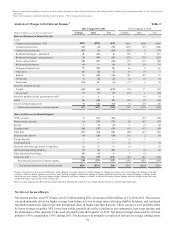
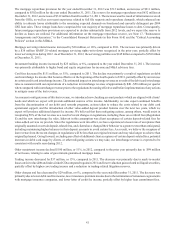
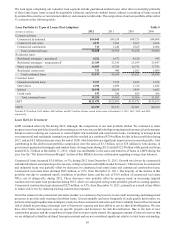
Analysis of Changes in Net Interest Income 1Table 2
2012 Compared to 2011 2011 Compared to 2010
(Dollars in millions on a taxable-equivalent basis) Volume Rate Net Volume Rate Net
Increase/(Decrease) in Interest Income
Loans:
Commercial and industrial - FTE 2$250 ($289) ($39) $496 ($98) $398
Commercial real estate (29) (4) (33) (293) (53) (346)
Commercial construction (13) (1) (14) (82) 5 (77)
Residential mortgages - guaranteed 31 (23) 8 125 2 127
Residential mortgages - nonguaranteed 34 (99) (65) (172) (75) (247)
Home equity products (32) (11) (43) (33) (15) (48)
Residential construction (9) — (9) 35 (1) 34
Guaranteed student loans 77 (21) 56 63 6 69
Other direct 16 (8) 8 14 (7) 7
Indirect 33 (69) (36) 107 (92) 15
Credit cards 6 (8) (2) (6) (1) (7)
Nonaccrual (14) 11 (3) (11) 6 (5)
Securities available for sale:
Taxable (65) (65) (130) (32) 17 (15)
Tax-exempt 2(7) (1) (8) (15) 1 (14)
Securities purchased under agreements to resell —11— (1) (1)
LHFS 36 (18) 18 (43) (1) (44)
Interest earning trading assets 8 (22) (14) 14 (24) (10)
Total increase/(decrease) in interest income 322 (627) (305) 167 (331) (164)
(Decrease)/Increase in Interest Expense
NOW accounts 1 (13) (12) — (23) (23)
Money market accounts (3) (70) (73) 20 (87) (67)
Savings 1 (3) (2) 1 (3) (2)
Consumer time (28) (25) (53) (31) (37) (68)
Other time (17) (14) (31) (40) (27) (67)
Brokered time deposits (4) (20) (24) (11) 2 (9)
Foreign deposits ——— (1) 1 —
Funds purchased ——— (1) — (1)
Securities sold under agreements to repurchase (1) 1 — (1) — (1)
Interest-bearing trading liabilities (5) (6) (11) — (5) (5)
Other short-term borrowings 10 (4) 6 2 (2) —
Long-term debt (52) (99) (151) (89) (41) (130)
Total (decrease)/increase in interest expense (98) (253) (351) (151) (222) (373)
Net increase/(decrease) in net interest income $420 ($374) $46 $318 ($109) $209
1 Changes in net interest income are attributed to either changes in average balances (volume change) or changes in average rates (rate change) for earning assets and
sources of funds on which interest is received or paid. Volume change is calculated as change in volume times the previous rate, while rate change is change in rate
times the previous volume. The rate/volume change, change in rate times change in volume, is allocated between volume change and rate change at the ratio each
component bears to the absolute value of their total.
2 Interest income includes the effects of the taxable-equivalent adjustments to increase tax-exempt interest income to a taxable-equivalent basis.
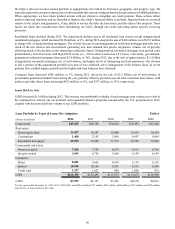
Net Interest Income/Margin
Net interest income, on an FTE basis, was $5.2 billion during 2012, an increase of $46 million, or 1%, from 2011. The increase
was predominantly driven by higher average loan balances, lower average interest-bearing liability balances, and continued
favorable trends in the deposit mix that included declines in higher cost time deposits. These variances were partially offset
by lower average securities AFS, lower loan yields, partially driven by a decline in our commercial loan swap income, and
the elimination of the quarterly Coke stock dividend in the third quarter of 2012. Net interest margin decreased by 10 basis
points to 3.40% compared to 3.50% during 2011. The decrease was primarily a result of an increase in average earning assets