SunTrust 2012 Annual Report Download - page 143
Download and view the complete annual report
Please find page 143 of the 2012 SunTrust annual report below. You can navigate through the pages in the report by either clicking on the pages listed below, or by using the keyword search tool below to find specific information within the annual report.-
 1
1 -
2
-
3
-
4
-
5
-
6
-
7
-
8
-
9
-
10
-
11
-
12
-
13
-
14
-
15
-
16
-
17
-
18
-
19
-
20
-
21
-
22
-
23
-
24
-
25
-
26
-
27
-
28
-
29
-
30
-
31
-
32
-
33
-
34
-
35
-
36
-
37
-
38
-
39
-
40
-
41
-
42
-
43
-
44
-
45
-
46
-
47
-
48
-
49
-
50
-
51
-
52
-
53
-
54
-
55
-
56
-
57
-
58
-
59
-
60
-
61
-
62
-
63
-
64
-
65
-
66
-
67
-
68
-
69
-
70
-
71
-
72
-
73
-
74
-
75
-
76
-
77
-
78
-
79
-
80
-
81
-
82
-
83
-
84
-
85
-
86
-
87
-
88
-
89
-
90
-
91
-
92
-
93
-
94
-
95
-
96
-
97
-
98
-
99
-
100
-
101
-
102
-
103
-
104
-
105
-
106
-
107
-
108
-
109
-
110
-
111
-
112
-
113
-
114
-
115
-
116
-
117
-
118
-
119
-
120
-
121
-
122
-
123
-
124
-
125
-
126
-
127
-
128
-
129
-
130
-
131
-
132
-
 133
133 -
 134
134 -
 135
135 -
 136
136 -
 137
137 -
 138
138 -
 139
139 -
 140
140 -
 141
141 -
 142
142 -
 143
143 -
 144
144 -
 145
145 -
 146
146 -
 147
147 -
 148
148 -
 149
149 -
 150
150 -
 151
151 -
 152
152 -
 153
153 -
154
-
155
-
156
-
157
-
158
-
159
-
160
-
161
-
162
-
163
-
164
-
165
-
166
-
167
-
168
-
169
-
170
-
171
-
172
-
173
-
174
-
175
-
176
-
177
-
178
-
179
-
180
-
181
-
182
-
183
-
184
-
185
-
186
-
187
-
188
-
189
-
190
-
191
-
192
-
193
-
194
-
195
-
196
-
197
-
198
-
199
-
200
-
201
-
202
-
203
-
204
-
205
-
206
-
207
-
208
-
209
-
210
-
211
-
212
-
213
-
214
-
215
-
216
-
217
-
218
-
219
-
220
-
221
-
222
-
223
-
224
-
225
-
226
-
227
-
228
 |
 |

Notes to Consolidated Financial Statements (Continued)
127
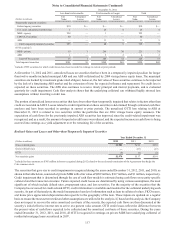
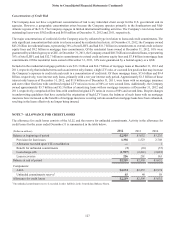
Concentrations of Credit Risk
The Company does not have a significant concentration of risk to any individual client except for the U.S. government and its
agencies. However, a geographic concentration arises because the Company operates primarily in the Southeastern and Mid-
Atlantic regions of the U.S. The Company engages in limited international banking activities. The Company’s total cross-border
outstanding loans were $562 million and $630 million at December 31, 2012 and 2011, respectively.
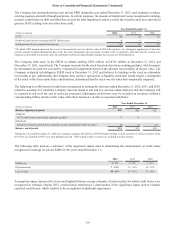
The major concentrations of credit risk for the Company arise by collateral type in relation to loans and credit commitments. The
only significant concentration that exists is in loans secured by residential real estate. At December 31, 2012, the Company owned
$43.2 billion in residential loans, representing 36% of total LHFI, and had $11.7 billion in commitments to extend credit on home
equity lines and $9.2 billion in mortgage loan commitments. Of the residential loans owned at December 31, 2012, 10% were
guaranteed by a federal agency or a GSE. At December 31, 2011, the Company owned $46.7 billion in residential loans, representing
38% of total LHFI, and had $12.7 billion in commitments to extend credit on home equity lines and $7.8 billion in mortgage loan
commitments. Of the residential loans owned at December 31, 2011, 14% were guaranteed by a federal agency or a GSE.
Included in the residential mortgage portfolio were $13.3 billion and $14.7 billion of mortgage loans at December 31, 2012 and
2011, respectively, that included terms such as an interest only feature, a high LTV ratio, or a second lien position that may increase
the Company’s exposure to credit risk and result in a concentration of credit risk. Of these mortgage loans, $7.6 billion and $9.4
billion, respectively, were interest only loans, primarily with a ten year interest only period. Approximately $1.5 billion of those
interest only loans as of December 31, 2012, and $1.9 billion as of December 31, 2011, were loans with no mortgage insurance
and were either first liens with combined original LTV ratios in excess of 80% or were second liens. Additionally, the Company
owned approximately $5.7 billion and $5.3 billion of amortizing loans with no mortgage insurance at December 31, 2012 and
2011, respectively, comprised of first liens with combined original LTV ratios in excess of 80% and second liens. Despite changes
in underwriting guidelines that have curtailed the origination of high LTV loans, the balances of such loans with no mortgage
insurance have increased as the benefits of mortgage insurance covering certain second lien mortgage loans have been exhausted,
resulting in the loans effectively no longer being insured.
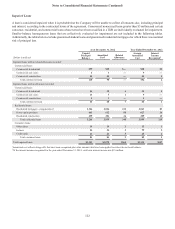
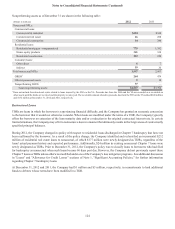
NOTE 7 - ALLOWANCE FOR CREDIT LOSSES
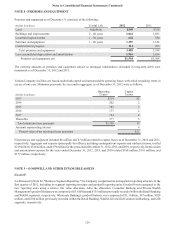
The allowance for credit losses consists of the ALLL and the reserve for unfunded commitments. Activity in the allowance for
credit losses for the years ended December 31 is summarized in the table below:
(Dollars in millions) 2012 2011 2010
Balance at beginning of period $2,505 $3,032 $3,235
Provision for loan losses 1,398 1,523 2,708
Allowance recorded upon VIE consolidation —— 1
Benefit for unfunded commitments (3)(10)(57)
Loan charge-offs (1,907)(2,241)(3,018)
Loan recoveries 226 201 163
Balance at end of period $2,219 $2,505 $3,032
Components:
ALLL $2,174 $2,457 $2,974
Unfunded commitments reserve145 48 58
Allowance for credit losses $2,219 $2,505 $3,032
1 The unfunded commitments reserve is recorded in other liabilities in the Consolidated Balance Sheets.