SunTrust 2012 Annual Report Download - page 65
Download and view the complete annual report
Please find page 65 of the 2012 SunTrust annual report below. You can navigate through the pages in the report by either clicking on the pages listed below, or by using the keyword search tool below to find specific information within the annual report.-
 1
1 -
2
-
3
-
4
-
5
-
6
-
7
-
8
-
9
-
10
-
11
-
12
-
13
-
14
-
15
-
16
-
17
-
18
-
19
-
20
-
21
-
22
-
23
-
24
-
25
-
26
-
27
-
28
-
29
-
30
-
31
-
32
-
33
-
34
-
35
-
36
-
37
-
38
-
39
-
40
-
41
-
42
-
43
-
44
-
45
-
46
-
47
-
48
-
49
-
50
-
51
-
52
-
53
-
54
-
 55
55 -
 56
56 -
 57
57 -
 58
58 -
 59
59 -
 60
60 -
 61
61 -
 62
62 -
 63
63 -
 64
64 -
 65
65 -
 66
66 -
 67
67 -
 68
68 -
 69
69 -
 70
70 -
 71
71 -
 72
72 -
 73
73 -
 74
74 -
 75
75 -
76
-
77
-
78
-
79
-
80
-
81
-
82
-
83
-
84
-
85
-
86
-
87
-
88
-
89
-
90
-
91
-
92
-
93
-
94
-
95
-
96
-
97
-
98
-
99
-
100
-
101
-
102
-
103
-
104
-
105
-
106
-
107
-
108
-
109
-
110
-
111
-
112
-
113
-
114
-
115
-
116
-
117
-
118
-
119
-
120
-
121
-
122
-
123
-
124
-
125
-
126
-
127
-
128
-
129
-
130
-
131
-
132
-
133
-
134
-
135
-
136
-
137
-
138
-
139
-
140
-
141
-
142
-
143
-
144
-
145
-
146
-
147
-
148
-
149
-
150
-
151
-
152
-
153
-
154
-
155
-
156
-
157
-
158
-
159
-
160
-
161
-
162
-
163
-
164
-
165
-
166
-
167
-
168
-
169
-
170
-
171
-
172
-
173
-
174
-
175
-
176
-
177
-
178
-
179
-
180
-
181
-
182
-
183
-
184
-
185
-
186
-
187
-
188
-
189
-
190
-
191
-
192
-
193
-
194
-
195
-
196
-
197
-
198
-
199
-
200
-
201
-
202
-
203
-
204
-
205
-
206
-
207
-
208
-
209
-
210
-
211
-
212
-
213
-
214
-
215
-
216
-
217
-
218
-
219
-
220
-
221
-
222
-
223
-
224
-
225
-
226
-
227
-
228
 |
 |

49
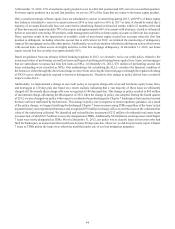
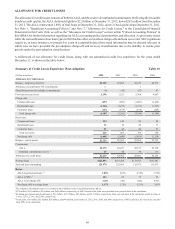
ALLOWANCE FOR CREDIT LOSSES
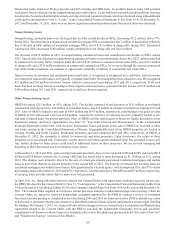
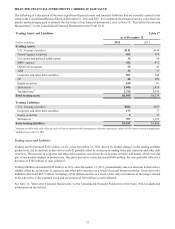
The allowance for credit losses consists of both the ALLL and the reserve for unfunded commitments. Reflecting the favorable
trends in credit quality, the ALLL declined slightly to $2.2 billion at December 31, 2012, down $283 million from December
31, 2011. The ALLL represented 1.80% of total loans at December 31, 2012, down 21 basis points from December 31, 2011.
See Note 1, "Significant Accounting Policies," and Note 7, "Allowance for Credit Losses," to the Consolidated Financial
Statements in this Form 10-K, as well as the "Allowance for Credit Losses" section within "Critical Accounting Policies" in
this MD&A for further information regarding our ALLL accounting policy, determination, and allocation. As previously noted,
while the reclassification of our loan types in 2010 had no effect on total loan charge-offs and loan recoveries, SEC regulations
require us, in some instances, to present five years of comparable data where trend information may be deemed relevant, in
which case we have provided the pre-adoption charge-off and recovery classifications due to the inability to restate prior
periods under the post-adoption classifications.
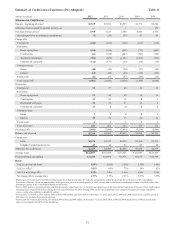
A rollforward of our allowance for credit losses, along with our summarized credit loss experience for the years ended
December 31, is shown in the table below:
Summary of Credit Losses Experience (Post-Adoption) Table 10
(Dollars in millions) 2012 2011 2010 2009
Allowance for Credit Losses
Balance - beginning of period $2,505 $3,032 $3,235 $2,379
Allowance recorded upon VIE consolidation —— 1 —
(Benefit)/provision for unfunded commitments (3) (10) (57) 87
Provision for loan losses 1,398 1,523 2,708 4,007
Charge-offs:
Commercial loans (457) (803) (1,087) (1,432)
Residential loans (1,316) (1,275) (1,736) (1,707)
Consumer loans (134) (163) (195) (259)
Total charge-offs (1,907) (2,241) (3,018) (3,398)
Recoveries:
Commercial loans 154 140 99 84
Residential loans 31 18 20 17
Consumer loans 41 43 44 59
Total recoveries 226 201 163 160
Net charge-offs (1,681) (2,040) (2,855) (3,238)
Balance - end of period $2,219 $2,505 $3,032 $3,235
Components:
ALLL $2,174 $2,457 $2,974 $3,120
Unfunded commitments reserve 145 48 58 115
Allowance for credit losses $2,219 $2,505 $3,032 $3,235
Average loans $122,893 $116,308 $113,925 $121,041
Year-end loans outstanding 121,470 122,495 115,975 113,675
Ratios:
ALLL to period-end loans 2,3 1.80% 2.01% 2.58% 2.76%
ALLL to NPLs 4142 85 73 59
ALLL to net charge-offs 1.29x 1.20x 1.04x 0.96x
Net charge-offs to average loans 1.37% 1.75% 2.51% 2.67%
1 The unfunded commitments reserve is recorded in other liabilities in the Consolidated Balance Sheets.
2 $379 million, $433 million, $492 million, and $449 million, respectively, of LHFI carried at fair value were excluded from year-end loans in the calculation.
3 Excluding government-guaranteed loans of $9.6 billion, $13.9 billion, $8.8 billion, and $3.7 billion, respectively, from year-end loans in the calculation results in ratios of
1.95%, 2.27%, 2.79%, and 2.84%, respectively.
4 For the ratio, $19 million, $25 million, $28 million, and $46 million, at December 31, 2012, 2011, 2010, and 2009, respectively, of NPLs carried at fair value were excluded
from NPLs in the calculation.