SunTrust 2012 Annual Report Download - page 181
Download and view the complete annual report
Please find page 181 of the 2012 SunTrust annual report below. You can navigate through the pages in the report by either clicking on the pages listed below, or by using the keyword search tool below to find specific information within the annual report.-
 1
1 -
2
-
3
-
4
-
5
-
6
-
7
-
8
-
9
-
10
-
11
-
12
-
13
-
14
-
15
-
16
-
17
-
18
-
19
-
20
-
21
-
22
-
23
-
24
-
25
-
26
-
27
-
28
-
29
-
30
-
31
-
32
-
33
-
34
-
35
-
36
-
37
-
38
-
39
-
40
-
41
-
42
-
43
-
44
-
45
-
46
-
47
-
48
-
49
-
50
-
51
-
52
-
53
-
54
-
55
-
56
-
57
-
58
-
59
-
60
-
61
-
62
-
63
-
64
-
65
-
66
-
67
-
68
-
69
-
70
-
71
-
72
-
73
-
74
-
75
-
76
-
77
-
78
-
79
-
80
-
81
-
82
-
83
-
84
-
85
-
86
-
87
-
88
-
89
-
90
-
91
-
92
-
93
-
94
-
95
-
96
-
97
-
98
-
99
-
100
-
101
-
102
-
103
-
104
-
105
-
106
-
107
-
108
-
109
-
110
-
111
-
112
-
113
-
114
-
115
-
116
-
117
-
118
-
119
-
120
-
121
-
122
-
123
-
124
-
125
-
126
-
127
-
128
-
129
-
130
-
131
-
132
-
133
-
134
-
135
-
136
-
137
-
138
-
139
-
140
-
141
-
142
-
143
-
144
-
145
-
146
-
147
-
148
-
149
-
150
-
151
-
152
-
153
-
154
-
155
-
156
-
157
-
158
-
159
-
160
-
161
-
162
-
163
-
164
-
165
-
166
-
167
-
168
-
169
-
170
-
 171
171 -
 172
172 -
 173
173 -
 174
174 -
 175
175 -
 176
176 -
 177
177 -
 178
178 -
 179
179 -
 180
180 -
 181
181 -
 182
182 -
 183
183 -
 184
184 -
 185
185 -
 186
186 -
 187
187 -
 188
188 -
 189
189 -
 190
190 -
 191
191 -
192
-
193
-
194
-
195
-
196
-
197
-
198
-
199
-
200
-
201
-
202
-
203
-
204
-
205
-
206
-
207
-
208
-
209
-
210
-
211
-
212
-
213
-
214
-
215
-
216
-
217
-
218
-
219
-
220
-
221
-
222
-
223
-
224
-
225
-
226
-
227
-
228
 |
 |

Notes to Consolidated Financial Statements (Continued)
165
in issuing letters of credit is essentially the same as that involved in extending loan facilities to clients and may be reduced
by selling participations to third parties. The Company issues letters of credit that are classified as financial standby,
performance standby, or commercial letters of credit.
As of December 31, 2012 and 2011, the maximum potential amount of the Company’ s obligation was $4.0 billion and
$5.2 billion, respectively, for financial and performance standby letters of credit. The Company’s outstanding letters of
credit generally have a term of less than one year but may extend longer. If a letter of credit is drawn upon, the Company
may seek recourse through the client’ s underlying obligation. If the client’ s line of credit is also in default, the Company
may take possession of the collateral securing the line of credit, where applicable. The Company monitors its credit exposure
under standby letters of credit in the same manner as it monitors other extensions of credit in accordance with credit
policies. Some standby letters of credit are designed to be drawn upon and others are drawn upon only under circumstances
of dispute or default in the underlying transaction to which the Company is not a party. In all cases, the Company holds
the right to reimbursement from the applicant and may or may not also hold collateral to secure that right. An internal
assessment of the PD and loss severity in the event of default is assessed consistent with the methodologies used for all
commercial borrowers. The management of credit risk regarding letters of credit leverages the risk rating process to focus
higher visibility on the higher risk and higher dollar letters of credit. The associated reserve is a component of the unfunded
commitment reserve recorded in other liabilities in the Consolidated Balance Sheets and included in the allowance for
credit losses as disclosed in Note 7, “Allowance for Credit Losses.” Additionally, unearned fees relating to letters of credit
are recorded in other liabilities. The net carrying amount of unearned fees was immaterial as of December 31, 2012 and
2011.
Loan Sales
STM, a consolidated subsidiary of SunTrust, originates and purchases residential mortgage loans, a portion of which are
sold to outside investors in the normal course of business, through a combination of whole loan sales to GSEs, Ginnie
Mae, and non-agency investors. Prior to 2008, the Company also sold loans through a limited number of Company sponsored
securitizations. When mortgage loans are sold, representations and warranties regarding certain attributes of the loans sold
are made to these third party purchasers. Subsequent to the sale, if a material underwriting deficiency or documentation
defect is discovered, STM may be obligated to repurchase the mortgage loan or to reimburse the investor for losses incurred
(make whole requests) if such deficiency or defect cannot be cured by STM within the specified period following discovery.
Defects in the securitization process or breaches of underwriting and servicing representations and warranties can result
in loan repurchases, as well as adversely affect the valuation of MSRs, servicing advances, or other mortgage loan-related
exposures, such as OREO. These representations and warranties may extend through the life of the mortgage loan. STM’s
risk of loss under its representations and warranties is largely driven by borrower payment performance since investors
will perform extensive reviews of delinquent loans as a means of mitigating losses.
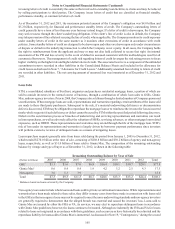
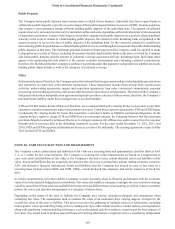
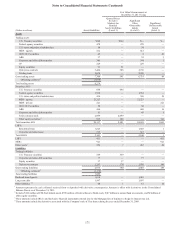
Loan repurchase requests generally arise from loans sold during the period from January 1, 2005 to December 31, 2012,
which totaled $270.0 billion at the time of sale, consisting of $208.8 billion and $30.2 billion of agency and non-agency
loans, respectively, as well as $31.0 billion of loans sold to Ginnie Mae. The composition of the remaining outstanding
balance by vintage and type of buyer as of December 31, 2012, is shown in the following table:
Remaining Outstanding Balance by Year of Sale
(Dollars in billions) 2005 2006 2007 2008 2009 2010 2011 2012 Total
GSE1$3.1 $3.6 $7.0 $6.8 $16.4 $10.1 $10.7 $20.1 $77.8
Ginnie Mae10.6 0.4 0.4 1.9 4.2 3.2 2.5 4.3 17.5
Non-agency 3.6 5.3 3.9 — — — — — 12.8
Total $7.3 $9.3 $11.3 $8.7 $20.6 $13.3 $13.2 $24.4 $108.1
1 Balances based on loans serviced by the Company.
Non-agency loan sales include whole loans and loans sold in private securitization transactions. While representations and
warranties have been made related to these sales, they differ in many cases from those made in connection with loans sold
to the GSEs in that non-agency loans may not be required to meet the same underwriting standards and non-agency investors
are generally required to demonstrate that the alleged breach was material and caused the investors' loss. Loans sold to
Ginnie Mae are insured by either the FHA or VA. As servicer, we may elect to repurchase delinquent loans in accordance
with Ginnie Mae guidelines; however, the loans continue to be insured. Although we indemnify the FHA and VA for losses
related to loans not originated in accordance with their guidelines, such occurrences have historically been limited and the
repurchase liability for loans sold to Ginnie Mae is immaterial. As discussed in Note 19, "Contingencies," during the second