SunTrust 2012 Annual Report Download - page 57
Download and view the complete annual report
Please find page 57 of the 2012 SunTrust annual report below. You can navigate through the pages in the report by either clicking on the pages listed below, or by using the keyword search tool below to find specific information within the annual report.-
 1
1 -
2
-
3
-
4
-
5
-
6
-
7
-
8
-
9
-
10
-
11
-
12
-
13
-
14
-
15
-
16
-
17
-
18
-
19
-
20
-
21
-
22
-
23
-
24
-
25
-
26
-
27
-
28
-
29
-
30
-
31
-
32
-
33
-
34
-
35
-
36
-
37
-
38
-
39
-
40
-
41
-
42
-
43
-
44
-
45
-
46
-
 47
47 -
 48
48 -
 49
49 -
 50
50 -
 51
51 -
 52
52 -
 53
53 -
 54
54 -
 55
55 -
 56
56 -
 57
57 -
 58
58 -
 59
59 -
 60
60 -
 61
61 -
 62
62 -
 63
63 -
 64
64 -
 65
65 -
 66
66 -
 67
67 -
68
-
69
-
70
-
71
-
72
-
73
-
74
-
75
-
76
-
77
-
78
-
79
-
80
-
81
-
82
-
83
-
84
-
85
-
86
-
87
-
88
-
89
-
90
-
91
-
92
-
93
-
94
-
95
-
96
-
97
-
98
-
99
-
100
-
101
-
102
-
103
-
104
-
105
-
106
-
107
-
108
-
109
-
110
-
111
-
112
-
113
-
114
-
115
-
116
-
117
-
118
-
119
-
120
-
121
-
122
-
123
-
124
-
125
-
126
-
127
-
128
-
129
-
130
-
131
-
132
-
133
-
134
-
135
-
136
-
137
-
138
-
139
-
140
-
141
-
142
-
143
-
144
-
145
-
146
-
147
-
148
-
149
-
150
-
151
-
152
-
153
-
154
-
155
-
156
-
157
-
158
-
159
-
160
-
161
-
162
-
163
-
164
-
165
-
166
-
167
-
168
-
169
-
170
-
171
-
172
-
173
-
174
-
175
-
176
-
177
-
178
-
179
-
180
-
181
-
182
-
183
-
184
-
185
-
186
-
187
-
188
-
189
-
190
-
191
-
192
-
193
-
194
-
195
-
196
-
197
-
198
-
199
-
200
-
201
-
202
-
203
-
204
-
205
-
206
-
207
-
208
-
209
-
210
-
211
-
212
-
213
-
214
-
215
-
216
-
217
-
218
-
219
-
220
-
221
-
222
-
223
-
224
-
225
-
226
-
227
-
228
 |
 |
41
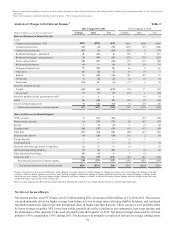
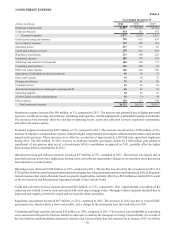
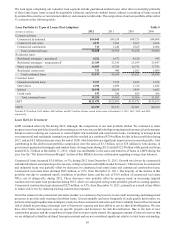
The mortgage repurchase provision for the year ended December 31, 2012 was $713 million, an increase of $211 million,
compared to $502 million for the year ended December 31, 2011. The reserve for mortgage repurchases was $632 million at
December 31, 2012, an increase of $312 million from December 31, 2011. The increase was the result of information received
from the GSEs, as well as our recent experience related to full file requests and repurchase demands, which enhanced our
ability to estimate losses attributable to the remaining expected demands on foreclosed and currently delinquent pre-2009
GSE loan sales. These vintage loans have comprised the vast majority of mortgage repurchase losses to date. Consequently,
future mortgage repurchase provisions are expected to decline substantially from 2012 levels, and we expect the reserve to
decline as losses are realized. For additional information on the mortgage repurchase reserve, see Note 17, "Reinsurance
Arrangements and Guarantees," to the Consolidated Financial Statements in this Form 10-K and the "Critical Accounting
Policies" section in this MD&A.
Mortgage servicing related income increased by $36 million, or 16%, compared to 2011. The increase was primarily driven
by a $38 million HARP 2.0-related mortgage servicing rights write-down recognized in the prior year, partially offset by
lower servicing fees during 2012. As of December 31, 2012, the servicing portfolio was $145 billion compared to $158 billion
at December 31, 2011.
Investment banking income increased by $25 million, or 8%, compared to the year ended December 31, 2011. The increase
was primarily attributable to higher bond and equity originations fee income and M&A advisory fees.
Card fees decreased by $131 million, or 35%, compared to 2011. The decline was primarily a result of regulations on debit
card interchange fee income that became effective at the beginning of the fourth quarter of 2011, partially offset by an increase
in certain credit card interchange income. The estimated impact on interchange revenue as a result of the debit card interchange
rules is consistent with our expectations of a reduction in interchange revenue of approximately $40 - $50 million per quarter
when compared with interchange revenue prior to the regulations becoming effective and before implementation of any actions
to mitigate some of the lost revenue.
As a means to mitigate some of this lost revenue, we introduced new checking account products which are aligned with clients’
needs and which we expect will provide additional sources of fee income. Additionally, we also expect continued benefits
from the discontinuation of our debit card rewards programs, actions taken to reduce the costs related to our debit card
operational support, and the introduction of other value-added deposit product features over the next two years, which we
expect will produce additional deposit fee income. We believed that these mitigating actions, among others, would assist in
recapturing 50% of the lost revenue as a result of recent changes in regulations, including those on overdraft fees (Regulation
E) and the new interchange fee rules. Inherent in this assumption was client acceptance of certain deposit-related fees for
value-added services we provide. Since the regulations went into effect, we have experienced a lesser rate of acceptance than
originally assumed on certain deposit-related fees, and clients have changed their behavior to a greater extent than anticipated,
including maintaining higher balances in their deposit accounts to avoid certain fees. As a result, we believe the recapture of
lost revenue from the recent changes in regulations will be less than our original estimate and may take longer to achieve than
originally planned. Going forward, excluding any effect of additional client acceptance of certain deposit-related fees, potential
increases in debit card usage by clients, or other mitigating actions we may take, our interchange revenue is expected to be
consistent with results seen during 2012.
Other noninterest income declined $100 million, or 51%, in 2012, compared to the prior year primarily due to $99 million
of net losses, relating to sales of government-guaranteed mortgage loans.
Trading income decreased by $37 million, or 15%, compared to 2011. The decrease was primarily due to mark-to-market
losses on fair value debt and index-linked CDs compared to gains in 2011 and lower valuation gains related to illiquid securities,
partially offset by higher core trading income and a reduction in trading-related litigation reserves.
Other charges and fees decreased by $29 million, or 6%, compared to the year ended December 31, 2011. The decrease was
primarily due to lower debit card fee income, lower insurance premium income due to the termination of reinsurance agreements
with mortgage insurance companies, and lower letter of credit fee income, partially offset by higher loan commitment fees.