SunTrust 2012 Annual Report Download - page 166
Download and view the complete annual report
Please find page 166 of the 2012 SunTrust annual report below. You can navigate through the pages in the report by either clicking on the pages listed below, or by using the keyword search tool below to find specific information within the annual report.-
 1
1 -
2
-
3
-
4
-
5
-
6
-
7
-
8
-
9
-
10
-
11
-
12
-
13
-
14
-
15
-
16
-
17
-
18
-
19
-
20
-
21
-
22
-
23
-
24
-
25
-
26
-
27
-
28
-
29
-
30
-
31
-
32
-
33
-
34
-
35
-
36
-
37
-
38
-
39
-
40
-
41
-
42
-
43
-
44
-
45
-
46
-
47
-
48
-
49
-
50
-
51
-
52
-
53
-
54
-
55
-
56
-
57
-
58
-
59
-
60
-
61
-
62
-
63
-
64
-
65
-
66
-
67
-
68
-
69
-
70
-
71
-
72
-
73
-
74
-
75
-
76
-
77
-
78
-
79
-
80
-
81
-
82
-
83
-
84
-
85
-
86
-
87
-
88
-
89
-
90
-
91
-
92
-
93
-
94
-
95
-
96
-
97
-
98
-
99
-
100
-
101
-
102
-
103
-
104
-
105
-
106
-
107
-
108
-
109
-
110
-
111
-
112
-
113
-
114
-
115
-
116
-
117
-
118
-
119
-
120
-
121
-
122
-
123
-
124
-
125
-
126
-
127
-
128
-
129
-
130
-
131
-
132
-
133
-
134
-
135
-
136
-
137
-
138
-
139
-
140
-
141
-
142
-
143
-
144
-
145
-
146
-
147
-
148
-
149
-
150
-
151
-
152
-
153
-
154
-
155
-
 156
156 -
 157
157 -
 158
158 -
 159
159 -
 160
160 -
 161
161 -
 162
162 -
 163
163 -
 164
164 -
 165
165 -
 166
166 -
 167
167 -
 168
168 -
 169
169 -
 170
170 -
 171
171 -
 172
172 -
 173
173 -
 174
174 -
 175
175 -
 176
176 -
177
-
178
-
179
-
180
-
181
-
182
-
183
-
184
-
185
-
186
-
187
-
188
-
189
-
190
-
191
-
192
-
193
-
194
-
195
-
196
-
197
-
198
-
199
-
200
-
201
-
202
-
203
-
204
-
205
-
206
-
207
-
208
-
209
-
210
-
211
-
212
-
213
-
214
-
215
-
216
-
217
-
218
-
219
-
220
-
221
-
222
-
223
-
224
-
225
-
226
-
227
-
228
 |
 |

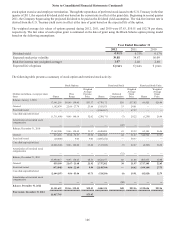
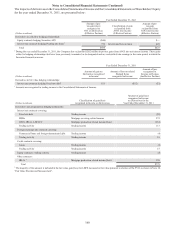
Notes to Consolidated Financial Statements (Continued)
150
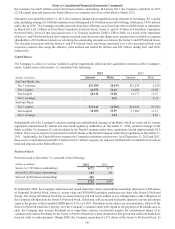
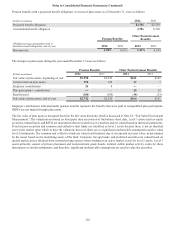
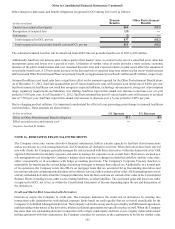
Pension benefits with a projected benefit obligation, in excess of plan assets as of December 31, were as follows:
(Dollars in millions) 2012 2011
Projected benefit obligation $2,701 $2,530
Accumulated benefit obligation 2,701 2,530
Pension Benefits Other Postretirement
Benefits
(Weighted average assumptions used to
determine benefit obligations, end of year) 2012 2011 2012 2011
Discount rate 4.08% 4.63% 3.45% 4.10%
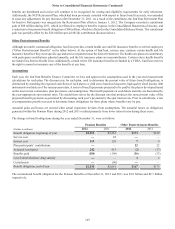
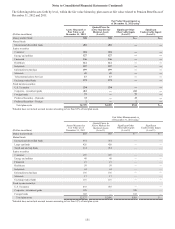
The changes in plan assets during the year ended December 31,were as follows:
Pension Benefits Other Postretirement Benefits
(Dollars in millions) 2012 2011 2012 2011
Fair value of plan assets, beginning of year $2,550 $2,522 $161 $165
Actual return on plan assets 350 129 17 7
Employer contributions 26 8——
Plan participants’ contributions ——22 22
Benefits paid (184)(109)(36)(33)
Fair value of plan assets, end of year $2,742 $2,550 $164 $161
Employer contributions indicated under pension benefits represent the benefits that were paid to nonqualified plan participants.
SERPs are not funded through plan assets.
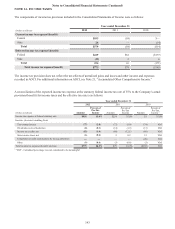
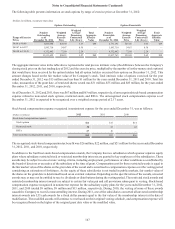
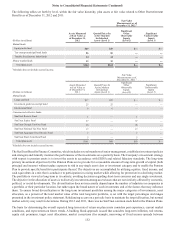
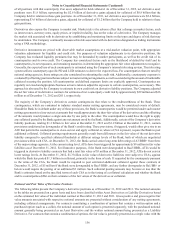
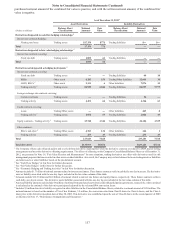
The fair value of plan assets is measured based on the fair value hierarchy which is discussed in Note 18, “Fair Value Election and
Measurement.” The valuations are based on third party data received as of the balance sheet date. Level 1 assets such as equity
securities, mutual funds, and REITs are instruments that are traded in active markets and are valued based on identical instruments.
Fixed income securities and common and collective trust funds are classified as level 2 assets because there is not an identical
asset in the market upon which to base the valuation; however, there are no significant unobservable assumptions used to value
level 2 instruments. The common and collective funds are valued each business day at its reported net asset value, as determined
by the issuer, based on the underlying assets of the fund. Corporate, foreign bonds, and preferred securities are valued based on
quoted market prices obtained from external pricing sources where trading in an active market exists for level 2 assets. Level 3
assets primarily consist of private placement and noninvestment grade bonds. Limited visible market activity exists for these
instruments or similar instruments, and therefore, significant unobservable assumptions are used to value the securities.