SunTrust 2012 Annual Report Download - page 115
Download and view the complete annual report
Please find page 115 of the 2012 SunTrust annual report below. You can navigate through the pages in the report by either clicking on the pages listed below, or by using the keyword search tool below to find specific information within the annual report.-
 1
1 -
2
-
3
-
4
-
5
-
6
-
7
-
8
-
9
-
10
-
11
-
12
-
13
-
14
-
15
-
16
-
17
-
18
-
19
-
20
-
21
-
22
-
23
-
24
-
25
-
26
-
27
-
28
-
29
-
30
-
31
-
32
-
33
-
34
-
35
-
36
-
37
-
38
-
39
-
40
-
41
-
42
-
43
-
44
-
45
-
46
-
47
-
48
-
49
-
50
-
51
-
52
-
53
-
54
-
55
-
56
-
57
-
58
-
59
-
60
-
61
-
62
-
63
-
64
-
65
-
66
-
67
-
68
-
69
-
70
-
71
-
72
-
73
-
74
-
75
-
76
-
77
-
78
-
79
-
80
-
81
-
82
-
83
-
84
-
85
-
86
-
87
-
88
-
89
-
90
-
91
-
92
-
93
-
94
-
95
-
96
-
97
-
98
-
99
-
100
-
101
-
102
-
103
-
104
-
 105
105 -
 106
106 -
 107
107 -
 108
108 -
 109
109 -
 110
110 -
 111
111 -
 112
112 -
 113
113 -
 114
114 -
 115
115 -
 116
116 -
 117
117 -
 118
118 -
 119
119 -
 120
120 -
 121
121 -
 122
122 -
 123
123 -
 124
124 -
 125
125 -
126
-
127
-
128
-
129
-
130
-
131
-
132
-
133
-
134
-
135
-
136
-
137
-
138
-
139
-
140
-
141
-
142
-
143
-
144
-
145
-
146
-
147
-
148
-
149
-
150
-
151
-
152
-
153
-
154
-
155
-
156
-
157
-
158
-
159
-
160
-
161
-
162
-
163
-
164
-
165
-
166
-
167
-
168
-
169
-
170
-
171
-
172
-
173
-
174
-
175
-
176
-
177
-
178
-
179
-
180
-
181
-
182
-
183
-
184
-
185
-
186
-
187
-
188
-
189
-
190
-
191
-
192
-
193
-
194
-
195
-
196
-
197
-
198
-
199
-
200
-
201
-
202
-
203
-
204
-
205
-
206
-
207
-
208
-
209
-
210
-
211
-
212
-
213
-
214
-
215
-
216
-
217
-
218
-
219
-
220
-
221
-
222
-
223
-
224
-
225
-
226
-
227
-
228
 |
 |

99
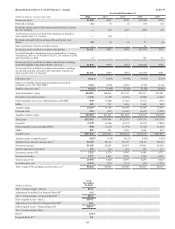
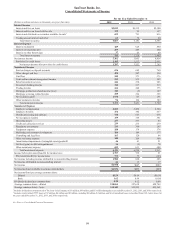
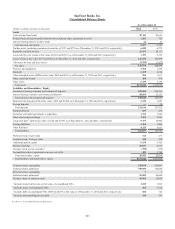
SunTrust Banks, Inc.
Consolidated Statements of Income
For the Year Ended December 31
(Dollars in millions and shares in thousands, except per share data) 2012 2011 2010
Interest Income
Interest and fees on loans $5,035 $5,219 $5,300
Interest and fees on loans held for sale 112 93 137
Interest and dividends on securities available for sale1655 791 816
Trading account interest and other 65 78 90
Total interest income 5,867 6,181 6,343
Interest Expense
Interest on deposits 429 624 860
Interest on long-term debt 299 449 580
Interest on other borrowings 37 43 49
Total interest expense 765 1,116 1,489
Net interest income 5,102 5,065 4,854
Provision for credit losses 1,395 1,513 2,651
Net interest income after provision for credit losses 3,707 3,552 2,203
Noninterest Income
Service charges on deposit accounts 676 685 760
Other charges and fees 478 507 534
Card fees 240 371 376
Trust and investment management income 512 531 503
Retail investment services 241 230 205
Investment banking income 342 317 313
Trading income 211 248 173
Mortgage production related income/(loss) 343 (5) 127
Mortgage servicing related income 260 224 358
Net securities gains21,974 117 191
Other noninterest income 96 196 189
Total noninterest income 5,373 3,421 3,729
Noninterest Expense
Employee compensation 2,603 2,494 2,364
Employee benefits 474 382 457
Outside processing and software 710 653 638
Net occupancy expense 359 356 361
Operating losses 277 377 83
Credit and collection services 239 275 279
Regulatory assessments 233 300 265
Equipment expense 188 178 174
Marketing and customer development 184 184 177
Consulting and legal fees 165 120 84
Other real estate expense 140 264 300
Amortization/impairment of intangible assets/goodwill 46 43 51
Net loss/(gain) on debt extinguishment 16 (3) 70
Other noninterest expense 689 611 608
Total noninterest expense 6,323 6,234 5,911
Income before provision/(benefit) for income taxes 2,757 739 21
Provision/(benefit) for income taxes 773 79 (185)
Net income including income attributable to noncontrolling interest 1,984 660 206
Net income attributable to noncontrolling interest 26 13 17
Net income $1,958 $647 $189
Net income/(loss) available to common shareholders $1,931 $495 ($87)
Net income/(loss) per average common share:
Diluted $3.59 $0.94 ($0.18)
Basic 3.62 0.94 (0.18)
Dividends declared per common share 0.20 0.12 0.04
Average common shares - diluted 538,061 527,618 498,744
Average common shares - basic 534,149 523,995 495,361
1 Includes dividends on common stock of The Coca-Cola Company of $31 million, $56 million, and $53 million during the years ended December 31, 2012, 2011, and 2010, respectively.
2 Includes credit-related OTTI losses of $7 million, $6 million and $2 million, including $6 million, $4 million, and $0 of unrealized losses reclassified from OCI, before taxes, for
the years ended December 31, 2012, 2011, and 2010, respectively.
See Notes to Consolidated Financial Statements.