SunTrust 2012 Annual Report Download - page 83
Download and view the complete annual report
Please find page 83 of the 2012 SunTrust annual report below. You can navigate through the pages in the report by either clicking on the pages listed below, or by using the keyword search tool below to find specific information within the annual report.-
 1
1 -
2
-
3
-
4
-
5
-
6
-
7
-
8
-
9
-
10
-
11
-
12
-
13
-
14
-
15
-
16
-
17
-
18
-
19
-
20
-
21
-
22
-
23
-
24
-
25
-
26
-
27
-
28
-
29
-
30
-
31
-
32
-
33
-
34
-
35
-
36
-
37
-
38
-
39
-
40
-
41
-
42
-
43
-
44
-
45
-
46
-
47
-
48
-
49
-
50
-
51
-
52
-
53
-
54
-
55
-
56
-
57
-
58
-
59
-
60
-
61
-
62
-
63
-
64
-
65
-
66
-
67
-
68
-
69
-
70
-
71
-
72
-
 73
73 -
 74
74 -
 75
75 -
 76
76 -
 77
77 -
 78
78 -
 79
79 -
 80
80 -
 81
81 -
 82
82 -
 83
83 -
 84
84 -
 85
85 -
 86
86 -
 87
87 -
 88
88 -
 89
89 -
 90
90 -
 91
91 -
 92
92 -
 93
93 -
94
-
95
-
96
-
97
-
98
-
99
-
100
-
101
-
102
-
103
-
104
-
105
-
106
-
107
-
108
-
109
-
110
-
111
-
112
-
113
-
114
-
115
-
116
-
117
-
118
-
119
-
120
-
121
-
122
-
123
-
124
-
125
-
126
-
127
-
128
-
129
-
130
-
131
-
132
-
133
-
134
-
135
-
136
-
137
-
138
-
139
-
140
-
141
-
142
-
143
-
144
-
145
-
146
-
147
-
148
-
149
-
150
-
151
-
152
-
153
-
154
-
155
-
156
-
157
-
158
-
159
-
160
-
161
-
162
-
163
-
164
-
165
-
166
-
167
-
168
-
169
-
170
-
171
-
172
-
173
-
174
-
175
-
176
-
177
-
178
-
179
-
180
-
181
-
182
-
183
-
184
-
185
-
186
-
187
-
188
-
189
-
190
-
191
-
192
-
193
-
194
-
195
-
196
-
197
-
198
-
199
-
200
-
201
-
202
-
203
-
204
-
205
-
206
-
207
-
208
-
209
-
210
-
211
-
212
-
213
-
214
-
215
-
216
-
217
-
218
-
219
-
220
-
221
-
222
-
223
-
224
-
225
-
226
-
227
-
228
 |
 |
67
General allowances are established for loans and leases grouped into pools that have similar characteristics, including smaller
balance homogeneous loans. The ALLL Committee estimates probable losses by evaluating quantitative and qualitative factors
for each loan portfolio segment, including net charge-off trends, internal risk ratings, changes in internal risk ratings, loss
forecasts, collateral values, geographic location, delinquency rates, nonperforming and restructured loans, origination channel,
product mix, underwriting practices, industry conditions, and economic trends. In addition to these factors, the consumer and
residential portfolio segments consider borrower FICO scores and the commercial portfolio segment considers single name
borrower concentration.
Estimated collateral valuations are based on appraisals, broker price opinions, recent sales of foreclosed properties, automated
valuation models, other property-specific information, and relevant market information, supplemented by our internal property
valuation professionals. The value estimate is based on an orderly disposition and marketing period of the property. In limited
instances, we adjust externally provided appraisals for justifiable and well supported reasons, such as an appraiser not being
aware of certain property-specific factors or recent sales information. Appraisals generally represent the “as is” value of the
property but may be adjusted based on the intended disposition strategy of the property.
Our determination of the ALLL for commercial loans is sensitive to the assigned internal risk ratings and inherent loss rates
at December 31, 2012. Assuming a downgrade of one level in the PD risk ratings for commercial loans and leases, the ALLL
would have increased by approximately $440 million at December 31, 2012. In the event that estimated loss severity rates
for the entire commercial loan portfolio increased by 10 percent, the ALLL for the commercial portfolio would increase by
approximately $90 million at December 31, 2012. Our determination of the allowance for residential and consumer loans is
also sensitive to changes in estimated loss severity rates. In the event that estimated loss severity rates for the residential and
consumer loan portfolio increased by 10 percent, the ALLL for the residential and consumer portfolios would increase, in
total, by approximately $90 million at December 31, 2012. Because several quantitative and qualitative factors are considered
in determining the ALLL, these sensitivity analyses do not necessarily reflect the nature and extent of future changes in the
ALLL. They are intended to provide insights into the impact of adverse changes in risk rating and estimated loss severity
rates and do not imply any expectation of future deterioration in the risk ratings or loss rates. Given current processes employed,
management believes the risk ratings and inherent loss rates currently assigned are appropriate. It is possible that others, given
the same information, may at any point in time reach different reasonable conclusions that could be material to our financial
statements.
In addition to the ALLL, we also estimate probable losses related to unfunded lending commitments, such as letters of credit
and binding unfunded loan commitments. Unfunded lending commitments are analyzed and segregated by risk similar to
funded loans based on our internal risk rating scale. These risk classifications, in combination with an analysis of historical
loss experience, probability of commitment usage, and any other pertinent information, result in the estimation of the reserve
for unfunded lending commitments.
Our financial results are affected by the changes in and the absolute level of the Allowance for Credit Losses. This process
involves our analysis of complex internal and external variables, and it requires that we exercise judgment to estimate an
appropriate Allowance for Credit Losses. As a result of the uncertainty associated with this subjectivity, we cannot assure the
precision of the amount reserved should we experience sizeable loan or lease losses in any particular period. For example,
changes in the financial condition of individual borrowers, economic conditions, or the condition of various markets in which
collateral may be sold could require us to significantly decrease or increase the level of the Allowance for Credit Losses. Such
an adjustment could materially affect net income as a result of the change in provision for credit losses. During the last three
years, we have experienced elevated delinquencies and net charge-offs in residential real estate loans due to the deterioration
of the housing market. These market conditions were considered in deriving the estimated Allowance for Credit Losses;
however, given the continued economic challenges and uncertainties, the ultimate amount of loss could vary from that estimate.
For additional discussion of the ALLL see the “Allowance for Credit Losses” and “Nonperforming Assets” sections in this
MD&A as well as Note 6, “Loans,” and Note 7, “Allowance for Credit Losses,” to the Consolidated Financial Statements in
this Form 10-K.
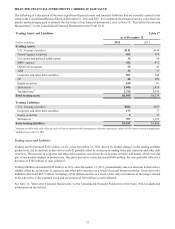
Mortgage Repurchase Reserve
We sell residential mortgage loans to investors through whole loan sales in the normal course of our business. The investors
are primarily GSEs; however, approximately 13% of the population of total loans sold between January 1, 2005 and December
31, 2012 were sold to non-agency investors, some in the form of securitizations. In association with these transactions, we
provide representations and warranties to the third party investors that these loans meet certain requirements as agreed to in
investor guidelines. In the last several years, we have seen a significant increase in claims from investors regarding material
breaches of these representations and warranties resulting in an elevated level in the repurchase liability. The majority of the
losses incurred have related to loans sold to investors from 2005 to 2008. We have experienced significantly fewer repurchase