SunTrust 2012 Annual Report Download - page 85
Download and view the complete annual report
Please find page 85 of the 2012 SunTrust annual report below. You can navigate through the pages in the report by either clicking on the pages listed below, or by using the keyword search tool below to find specific information within the annual report.-
 1
1 -
2
-
3
-
4
-
5
-
6
-
7
-
8
-
9
-
10
-
11
-
12
-
13
-
14
-
15
-
16
-
17
-
18
-
19
-
20
-
21
-
22
-
23
-
24
-
25
-
26
-
27
-
28
-
29
-
30
-
31
-
32
-
33
-
34
-
35
-
36
-
37
-
38
-
39
-
40
-
41
-
42
-
43
-
44
-
45
-
46
-
47
-
48
-
49
-
50
-
51
-
52
-
53
-
54
-
55
-
56
-
57
-
58
-
59
-
60
-
61
-
62
-
63
-
64
-
65
-
66
-
67
-
68
-
69
-
70
-
71
-
72
-
73
-
74
-
 75
75 -
 76
76 -
 77
77 -
 78
78 -
 79
79 -
 80
80 -
 81
81 -
 82
82 -
 83
83 -
 84
84 -
 85
85 -
 86
86 -
 87
87 -
 88
88 -
 89
89 -
 90
90 -
 91
91 -
 92
92 -
 93
93 -
 94
94 -
 95
95 -
96
-
97
-
98
-
99
-
100
-
101
-
102
-
103
-
104
-
105
-
106
-
107
-
108
-
109
-
110
-
111
-
112
-
113
-
114
-
115
-
116
-
117
-
118
-
119
-
120
-
121
-
122
-
123
-
124
-
125
-
126
-
127
-
128
-
129
-
130
-
131
-
132
-
133
-
134
-
135
-
136
-
137
-
138
-
139
-
140
-
141
-
142
-
143
-
144
-
145
-
146
-
147
-
148
-
149
-
150
-
151
-
152
-
153
-
154
-
155
-
156
-
157
-
158
-
159
-
160
-
161
-
162
-
163
-
164
-
165
-
166
-
167
-
168
-
169
-
170
-
171
-
172
-
173
-
174
-
175
-
176
-
177
-
178
-
179
-
180
-
181
-
182
-
183
-
184
-
185
-
186
-
187
-
188
-
189
-
190
-
191
-
192
-
193
-
194
-
195
-
196
-
197
-
198
-
199
-
200
-
201
-
202
-
203
-
204
-
205
-
206
-
207
-
208
-
209
-
210
-
211
-
212
-
213
-
214
-
215
-
216
-
217
-
218
-
219
-
220
-
221
-
222
-
223
-
224
-
225
-
226
-
227
-
228
 |
 |
69
Another factor is the investor selection and review process. We believe that the GSEs have primarily focused on defaulted
loans that have been through the foreclosure process, as well as outstanding loans that are seriously delinquent, and have been
much less focused on the outstanding loans that are current. We believe this is driven by the final dollar severity loss impact
to the GSEs. The more recent selections, as evidenced by the GSEs' requests for full loan files, have shown some shifts
towards outstanding loans that are current. This could suggest that the GSEs are working through the backlog of defaulted
and seriously delinquent loans from prior years and that the repurchase requests in the latter half of 2012 were due to an
acceleration of timing of repurchase requests.
Our liability for losses resulting from loan repurchases is initially based upon the fair value of these guarantees. Subsequently,
the liability is increased for probable losses based on the vintage, product, and investor level based on the most recent
information. The liability is calculated by sales vintage based on various factors including:
• pending repurchase demands,
• the population of loans that have ever been 120 or more days past due, including loans currently delinquent that
are expected to migrate to 120 days past due,
• the probability that a repurchase request related to a loan that has ever been or expected to be 120 or more days
past due will be received,
• the probability that a loan demanded for repurchase will be repurchased, and
• historical loss experience.
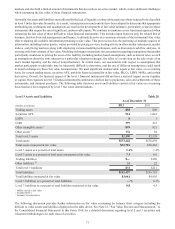
The previous table presented historical information regarding the population of defaulted loans and repurchase request rates.
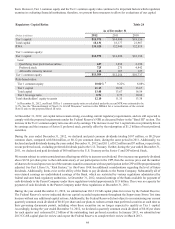
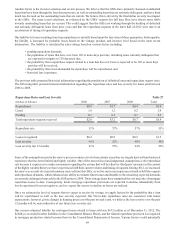
The following table presents historical information regarding the repurchase rates and loss severity for loans sold between
2006 to 2008.
Repurchase Rates and Loss Severity Table 27
(Dollars in billions) 2006 2007 2008 Total
Repurchased $0.9 $1.7 $0.4 $3.0
Cured 1.0 1.2 0.2 2.4
Pending 0.1 0.3 0.1 0.5
Total repurchase requests received $2.0 $3.2 $0.7 $5.9
Repurchase rate 51% 57% 57% 55%
Losses recognized $0.4 $0.9 $0.2 $1.5
Loss severity 45% 52% 48% 50%
Loss severity last 12 months 61% 55% 44% 54%
Some of the assumptions used in the reserve process contain a level of uncertainty since they are largely derived from historical
experience that has been limited and highly variable. One of the most critical and judgmental assumptions is the repurchase
rate because it requires us to make assessments regarding the actions that will be taken by third party investors in the context
of the highly variable history we have experienced with their current volume and timing of requests. During 2012, we increased
the reserve as a result of recent information received from the GSEs, as well as our recent experience related to full file requests
and repurchase demands, which enhanced our ability to estimate future losses attributable to the remaining expected demands
on currently delinquent loans sold to the GSEs prior to 2009. These vintage loans have comprised the vast majority of mortgage
repurchase losses to date. Consequently, future mortgage repurchase provisions are expected to decline substantially from
levels experienced in recent quarters, and we expect the reserve to decline as losses are realized.
Once we estimate the level of requests that we expect to receive by vintage, we apply factors for the probability that a loan
will be repurchased as well as the loss severity expected. Our life-to-date repurchase rates are consistent with future
expectations; however, given changes in housing prices over the past several years, we believe the loss severity over the past
12 months will be more indicative of our future loss severity rate.
Our current estimated liability for contingent losses related to loans sold was $632 million as of December 31, 2012. The
liability is recorded in other liabilities in the Consolidated Balance Sheets, and the related repurchase provision is recognized
in mortgage production related income/(loss) in the Consolidated Statements of Income. Various factors could potentially