PNC Bank 2009 Annual Report Download - page 95
Download and view the complete annual report
Please find page 95 of the 2009 PNC Bank annual report below. You can navigate through the pages in the report by either clicking on the pages listed below, or by using the keyword search tool below to find specific information within the annual report.-
 1
1 -
2
-
3
-
4
-
5
-
6
-
7
-
8
-
9
-
10
-
11
-
12
-
13
-
14
-
15
-
16
-
17
-
18
-
19
-
20
-
21
-
22
-
23
-
24
-
25
-
26
-
27
-
28
-
29
-
30
-
31
-
32
-
33
-
34
-
35
-
36
-
37
-
38
-
39
-
40
-
41
-
42
-
43
-
44
-
45
-
46
-
47
-
48
-
49
-
50
-
51
-
52
-
53
-
54
-
55
-
56
-
57
-
58
-
59
-
60
-
61
-
62
-
63
-
64
-
65
-
66
-
67
-
68
-
69
-
70
-
71
-
72
-
73
-
74
-
75
-
76
-
77
-
78
-
79
-
80
-
81
-
82
-
83
-
84
-
 85
85 -
 86
86 -
 87
87 -
 88
88 -
 89
89 -
 90
90 -
 91
91 -
 92
92 -
 93
93 -
 94
94 -
 95
95 -
 96
96 -
 97
97 -
 98
98 -
 99
99 -
 100
100 -
 101
101 -
 102
102 -
 103
103 -
 104
104 -
 105
105 -
106
-
107
-
108
-
109
-
110
-
111
-
112
-
113
-
114
-
115
-
116
-
117
-
118
-
119
-
120
-
121
-
122
-
123
-
124
-
125
-
126
-
127
-
128
-
129
-
130
-
131
-
132
-
133
-
134
-
135
-
136
-
137
-
138
-
139
-
140
-
141
-
142
-
143
-
144
-
145
-
146
-
147
-
148
-
149
-
150
-
151
-
152
-
153
-
154
-
155
-
156
-
157
-
158
-
159
-
160
-
161
-
162
-
163
-
164
-
165
-
166
-
167
-
168
-
169
-
170
-
171
-
172
-
173
-
174
-
175
-
176
-
177
-
178
-
179
-
180
-
181
-
182
-
183
-
184
-
185
-
186
-
187
-
188
-
189
-
190
-
191
-
192
-
193
-
194
-
195
-
196
 |
 |

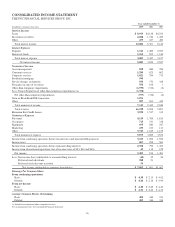
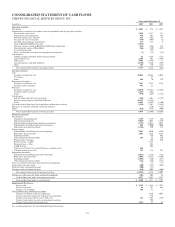
CONSOLIDATED STATEMENT OF CASH FLOWS
THE PNC FINANCIAL SERVICES GROUP, INC.
Year ended December 31
In millions 2009 2008 2007
Operating Activities
Net income $ 2,403 $ 914 $ 1,491
Adjustments to reconcile net income to net cash provided (used) by operating activities
Provision for credit losses 3,930 1,517 315
Depreciation and amortization 978 463 391
Deferred income taxes (benefit) 932 (261) 78
Net gains on sales of securities (550) (106) (1)
Net other-than-temporary impairments 577 312 6
Gain on BlackRock/BGI transaction (1,076)
Net losses (gains) related to BlackRock LTIP shares adjustment (103) (246) 127
Undistributed earnings of BlackRock (144) (129) (207)
Visa redemption gain (95)
Excess tax benefits from share-based payment arrangements (1) (13) (15)
Net change in
Trading securities and other short-term investments 61 1,459 (552)
Loans held for sale 1,110 303 (1,441)
Other assets 5,485 (1,974) 37
Accrued expenses and other liabilities (8,118) 5,140 (498)
Other 269 130 (147)
Net cash provided (used) by operating activities 5,753 7,414 (416)
Investing Activities
Sales
Securities available for sale 18,861 10,283 6,056
Visa shares 95
Loans 644 76 329
Repayments/maturities
Securities available for sale 7,291 4,225 4,374
Securities held to maturity 495 21
Purchases
Securities available for sale (34,078) (19,381) (15,884)
Securities held to maturity (2,367) (101)
Loans (970) (249) (2,747)
Net change in
Federal funds sold and resale agreements (560) 1,301 (1,147)
Interest-earning deposits with Federal Reserve 10,124 (6,234)
Loans 13,863 (4,595) (2,160)
Net cash received from (paid for) acquisition and divestiture activity (3,396) 2,761 (2,543)
Purchases of corporate and bank-owned life insurance (350) (117)
Other (428) (838) (800)
Net cash provided (used) by investing activities 9,479 (12,986) (14,639)
Financing Activities
Net change in
Noninterest-bearing deposits 7,169 1,719 230
Interest-bearing deposits (9,849) 2,065 1,769
Federal funds purchased and repurchase agreements (1,173) (8,081) 4,057
Federal Home Loan Bank short-term borrowings 280 (2,000) 2,000
Other short-term borrowed funds (1,726) 840 514
Sales/issuances
Federal Home Loan Bank long-term borrowings 2,092 5,050 4,750
Bank notes and senior debt 2,461 3,626 4,523
Subordinated debt 759 943
Other long-term borrowed funds 234 96 250
Perpetual trust securities 369 490
Preferred stock – TARP 7,275
Preferred stock – Other 492
TARP Warrant 304
Supervisory Capital Assessment Program—common stock 624
Common and treasury stock 247 375 253
Repayments/maturities
Federal Home Loan Bank long-term borrowings (9,671) (1,158) (232)
Bank notes and senior debt (3,887) (3,815) (1,590)
Subordinated debt (1,000) (140) (887)
Other long-term borrowed funds (211) (156) (217)
Excess tax benefits from share-based payment arrangements 113 15
Acquisition of treasury stock (188) (234) (963)
Preferred stock cash dividends paid (388) (21)
Common stock cash dividends paid (430) (902) (806)
Net cash provided (used) by financing activities (15,415) 6,476 15,099
Net Increase (Decrease) In Cash And Due From Banks (183) 904 44
Cash and due from banks at beginning of period 4,471 3,567 3,523
Cash and due from banks at end of period $ 4,288 $ 4,471 $ 3,567
Supplemental Disclosures
Interest paid $ 3,151 $ 2,145 $ 2,973
Income taxes paid 66 797 662
Income taxes refunded 718 91 3
Non-cash Investing and Financing Items
Issuance of common stock for acquisitions 5,916 4,019
Issuance of preferred stock for National City acquisition 150
Transfer from loans held for sale to loans, net 172 1,763 (288)
Transfer from trading securities to investment securities 599
Transfer from loans to foreclosed assets 1,012 45 24
See accompanying Notes To Consolidated Financial Statements.
91