PNC Bank 2009 Annual Report Download - page 153
Download and view the complete annual report
Please find page 153 of the 2009 PNC Bank annual report below. You can navigate through the pages in the report by either clicking on the pages listed below, or by using the keyword search tool below to find specific information within the annual report.-
 1
1 -
2
-
3
-
4
-
5
-
6
-
7
-
8
-
9
-
10
-
11
-
12
-
13
-
14
-
15
-
16
-
17
-
18
-
19
-
20
-
21
-
22
-
23
-
24
-
25
-
26
-
27
-
28
-
29
-
30
-
31
-
32
-
33
-
34
-
35
-
36
-
37
-
38
-
39
-
40
-
41
-
42
-
43
-
44
-
45
-
46
-
47
-
48
-
49
-
50
-
51
-
52
-
53
-
54
-
55
-
56
-
57
-
58
-
59
-
60
-
61
-
62
-
63
-
64
-
65
-
66
-
67
-
68
-
69
-
70
-
71
-
72
-
73
-
74
-
75
-
76
-
77
-
78
-
79
-
80
-
81
-
82
-
83
-
84
-
85
-
86
-
87
-
88
-
89
-
90
-
91
-
92
-
93
-
94
-
95
-
96
-
97
-
98
-
99
-
100
-
101
-
102
-
103
-
104
-
105
-
106
-
107
-
108
-
109
-
110
-
111
-
112
-
113
-
114
-
115
-
116
-
117
-
118
-
119
-
120
-
121
-
122
-
123
-
124
-
125
-
126
-
127
-
128
-
129
-
130
-
131
-
132
-
133
-
134
-
135
-
136
-
137
-
138
-
139
-
140
-
141
-
142
-
 143
143 -
 144
144 -
 145
145 -
 146
146 -
 147
147 -
 148
148 -
 149
149 -
 150
150 -
 151
151 -
 152
152 -
 153
153 -
 154
154 -
 155
155 -
 156
156 -
 157
157 -
 158
158 -
 159
159 -
 160
160 -
 161
161 -
 162
162 -
 163
163 -
164
-
165
-
166
-
167
-
168
-
169
-
170
-
171
-
172
-
173
-
174
-
175
-
176
-
177
-
178
-
179
-
180
-
181
-
182
-
183
-
184
-
185
-
186
-
187
-
188
-
189
-
190
-
191
-
192
-
193
-
194
-
195
-
196
 |
 |

N
OTE
18 E
ARNINGS
P
ER
S
HARE
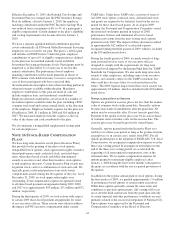
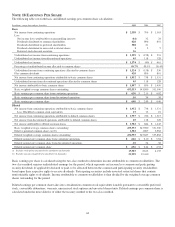
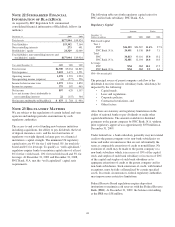
The following table sets forth basic and diluted earnings per common share calculations:
In millions, except share and per share data 2009 2008 2007
Basic
Net income from continuing operations $ 2,358 $ 796 $ 1,363
Less:
Net income (loss) attributable to noncontrolling interests (44) 32 24
Dividends distributed to common shareholders 428 896 801
Dividends distributed to preferred shareholders 388 21
Dividends distributed to nonvested restricted shares 155
Preferred stock discount accretion 56
Undistributed net income from continuing operations $ 1,529 $ (158) $ 533
Undistributed net income from discontinued operations 45 118 128
Undistributed net income $ 1,574 $ (40) $ 661
Percentage of undistributed income allocated to common shares 99.7% 99.5% 99.4%
Undistributed income from continuing operations allocated to common shares $ 1,524 $ (158) $ 530
Plus common dividends 428 896 801
Net income from continuing operations attributable to basic common shares $ 1,952 $ 738 $ 1,331
Undistributed income from discontinued operations allocated to common shares 45 118 128
Net income attributable to basic common shares $ 1,997 $ 856 $ 1,459
Basic weighted-average common shares outstanding 453,553 343,980 331,300
Basic earnings per common share from continuing operations $ 4.30 $ 2.15 $ 4.02
Basic earnings per common share from discontinued operations .10 .34 .38
Basic earnings per common share $ 4.40 $ 2.49 $ 4.40
Diluted
Net income from continuing operations attributable to basic common shares $ 1,952 $ 738 $ 1,331
Less: BlackRock common stock equivalents 15 12 16
Net income from continuing operations attributable to diluted common shares $ 1,937 $ 726 $ 1,315
Net income from discontinued operations attributable to diluted common shares 45 118 128
Net income attributable to diluted common shares $ 1,982 $ 844 $ 1,443
Basic weighted average common shares outstanding 453,553 343,980 331,300
Dilutive potential common shares (a) (b) 1,382 1,867 2,562
Diluted weighted-average common shares outstanding 454,935 345,847 333,862
Diluted earnings per common share from continuing operations $ 4.26 $ 2.10 $ 3.94
Diluted earnings per common share from discontinued operations .10 .34 .38
Diluted earnings per common share $ 4.36 $ 2.44 $ 4.32
(a) Excludes stock options considered to be anti-dilutive (in thousands) 15,303 8,815 4,135
(b) Excludes warrants considered to be anti-dilutive (in thousands) 21,929 19,410
Basic earnings per share is calculated using the two-class method to determine income attributable to common stockholders. The
two-class method requires undistributed earnings for the period, which represents net income less common and participating
security dividends (if applicable) declared or paid, to be allocated between the common and participating security stockholders
based upon their respective rights to receive dividends. Participating securities include unvested restricted shares that contain
nonforfeitable rights to dividends. Income attributable to common stockholders is then divided by the weighted-average common
shares outstanding for the period.
Diluted earnings per common share takes into consideration common stock equivalents issuable pursuant to convertible preferred
stock, convertible debentures, warrants, unexercised stock options and unvested shares/units. Diluted earnings per common share is
calculated under the more dilutive of either the treasury method or the two-class method.
149