PNC Bank 2009 Annual Report Download - page 156
Download and view the complete annual report
Please find page 156 of the 2009 PNC Bank annual report below. You can navigate through the pages in the report by either clicking on the pages listed below, or by using the keyword search tool below to find specific information within the annual report.-
 1
1 -
2
-
3
-
4
-
5
-
6
-
7
-
8
-
9
-
10
-
11
-
12
-
13
-
14
-
15
-
16
-
17
-
18
-
19
-
20
-
21
-
22
-
23
-
24
-
25
-
26
-
27
-
28
-
29
-
30
-
31
-
32
-
33
-
34
-
35
-
36
-
37
-
38
-
39
-
40
-
41
-
42
-
43
-
44
-
45
-
46
-
47
-
48
-
49
-
50
-
51
-
52
-
53
-
54
-
55
-
56
-
57
-
58
-
59
-
60
-
61
-
62
-
63
-
64
-
65
-
66
-
67
-
68
-
69
-
70
-
71
-
72
-
73
-
74
-
75
-
76
-
77
-
78
-
79
-
80
-
81
-
82
-
83
-
84
-
85
-
86
-
87
-
88
-
89
-
90
-
91
-
92
-
93
-
94
-
95
-
96
-
97
-
98
-
99
-
100
-
101
-
102
-
103
-
104
-
105
-
106
-
107
-
108
-
109
-
110
-
111
-
112
-
113
-
114
-
115
-
116
-
117
-
118
-
119
-
120
-
121
-
122
-
123
-
124
-
125
-
126
-
127
-
128
-
129
-
130
-
131
-
132
-
133
-
134
-
135
-
136
-
137
-
138
-
139
-
140
-
141
-
142
-
143
-
144
-
145
-
 146
146 -
 147
147 -
 148
148 -
 149
149 -
 150
150 -
 151
151 -
 152
152 -
 153
153 -
 154
154 -
 155
155 -
 156
156 -
 157
157 -
 158
158 -
 159
159 -
 160
160 -
 161
161 -
 162
162 -
 163
163 -
 164
164 -
 165
165 -
 166
166 -
167
-
168
-
169
-
170
-
171
-
172
-
173
-
174
-
175
-
176
-
177
-
178
-
179
-
180
-
181
-
182
-
183
-
184
-
185
-
186
-
187
-
188
-
189
-
190
-
191
-
192
-
193
-
194
-
195
-
196
 |
 |

N
OTE
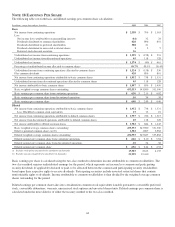
20 O
THER
C
OMPREHENSIVE
I
NCOME
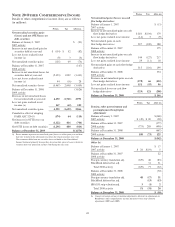
Details of other comprehensive income (loss) are as follows
(in millions):
Pretax Tax After-tax
Net unrealized securities gains
(losses) and net OTTI losses on
debt securities
Balance at January 1, 2007 $ (91)
2007 activity
Increase in net unrealized gain for
securities held at year-end $ (134) $ 52 (82)
Less: net losses realized in net
income (a) (9) 3 (6)
Net unrealized securities gains (125) 49 (76)
Balance at December 31, 2007 (167)
2008 activity
Increase in net unrealized losses for
securities held at year-end (5,423) 1,992 (3,431)
Less: net losses realized in net
income (a) 44 (16) 28
Net unrealized securities losses (5,467) 2,008 (3,459)
Balance at December 31, 2008 (3,626)
2009 activity
Decrease in net unrealized losses
for securities held at year-end 4,692 (1,721) 2,971
Less: net gains realized in net
income (a) 167 (62) 105
Net unrealized securities gains 4,525 (1,659) 2,866
Cumulative effect of adopting
FASB ASC 320-10 (174) 64 (110)
Net increase in OTTI losses on
debt securities (1,122) 416 (706)
Net OTTI losses on debt securities (1,296) 480 (816)
Balance at December 31, 2009 $(1,576)
(a) Pretax amounts represent net unrealized gains (losses) as of the prior year-end date
that were realized in the subsequent year when the related securities were sold.
These amounts differ from net securities losses included on the Consolidated
Income Statement primarily because they do not include gains or losses realized on
securities that were purchased and then sold during the same year.
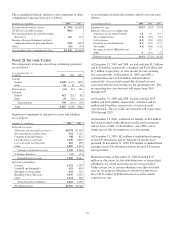
Pretax Tax After-tax
Net unrealized gains (losses) on cash
flow hedge derivatives
Balance at January 1, 2007 $ (13)
2007 activity
Increase in net unrealized gains on cash
flow hedge derivatives $ 283 $(104) 179
Less: net gains realized in net income (14) 5 (9)
Net unrealized gains on cash
flow hedge derivatives 297 (109) 188
Balance at December 31, 2007 175
2008 activity
Increase in net unrealized gains on cash
flow hedge derivatives 344 (127) 217
Less: net gains realized in net income 29 (11) 18
Net unrealized gains on cash flow hedge
derivatives 315 (116) 199
Balance at December 31, 2008 374
2009 activity
Decrease in net unrealized gains on cash
flow hedge derivatives (178) 66 (112)
Less: net gains realized in net income 151 (55) 96
Net unrealized losses on cash flow
hedge derivatives (329) 121 (208)
Balance at December 31, 2009 $ 166
Pretax Tax After-tax
Pension, other postretirement and
postemployment benefit plan
adjustments
Balance at January 1, 2007 $(148)
2007 activity $ (49) $ 20 (29)
Balance at December 31, 2007 (177)
2008 activity (775) 285 (490)
Balance at December 31, 2008 (667)
2009 activity 198 (73) 125
Balance at December 31, 2009 $(542)
Other (b)
Balance at January 1, 2007 $ 17
2007 activity $ 24 $ (19) 5
Balance at December 31, 2007 22
2008 activity
Foreign currency translation adj. (129) 46 (83)
BlackRock deferred tax adj. 31 31
Total 2008 activity (129) 77 (52)
Balance at December 31, 2008 (30)
2009 activity
Foreign currency translation adj. 48 (17) 31
BlackRock deferred tax adj. (13) (13)
SBA I/O strip valuation adj. 3 (1) 2
Total 2009 activity 51 (31) 20
Balance at December 31, 2009 $ (10)
(b) Consists of foreign currency translation adjustments, deferred tax adjustments on
BlackRock’s other comprehensive income and interest-only strip valuation
adjustments (2007) and (2009).
152