PNC Bank 2009 Annual Report Download - page 71
Download and view the complete annual report
Please find page 71 of the 2009 PNC Bank annual report below. You can navigate through the pages in the report by either clicking on the pages listed below, or by using the keyword search tool below to find specific information within the annual report.-
 1
1 -
2
-
3
-
4
-
5
-
6
-
7
-
8
-
9
-
10
-
11
-
12
-
13
-
14
-
15
-
16
-
17
-
18
-
19
-
20
-
21
-
22
-
23
-
24
-
25
-
26
-
27
-
28
-
29
-
30
-
31
-
32
-
33
-
34
-
35
-
36
-
37
-
38
-
39
-
40
-
41
-
42
-
43
-
44
-
45
-
46
-
47
-
48
-
49
-
50
-
51
-
52
-
53
-
54
-
55
-
56
-
57
-
58
-
59
-
60
-
 61
61 -
 62
62 -
 63
63 -
 64
64 -
 65
65 -
 66
66 -
 67
67 -
 68
68 -
 69
69 -
 70
70 -
 71
71 -
 72
72 -
 73
73 -
 74
74 -
 75
75 -
 76
76 -
 77
77 -
 78
78 -
 79
79 -
 80
80 -
 81
81 -
82
-
83
-
84
-
85
-
86
-
87
-
88
-
89
-
90
-
91
-
92
-
93
-
94
-
95
-
96
-
97
-
98
-
99
-
100
-
101
-
102
-
103
-
104
-
105
-
106
-
107
-
108
-
109
-
110
-
111
-
112
-
113
-
114
-
115
-
116
-
117
-
118
-
119
-
120
-
121
-
122
-
123
-
124
-
125
-
126
-
127
-
128
-
129
-
130
-
131
-
132
-
133
-
134
-
135
-
136
-
137
-
138
-
139
-
140
-
141
-
142
-
143
-
144
-
145
-
146
-
147
-
148
-
149
-
150
-
151
-
152
-
153
-
154
-
155
-
156
-
157
-
158
-
159
-
160
-
161
-
162
-
163
-
164
-
165
-
166
-
167
-
168
-
169
-
170
-
171
-
172
-
173
-
174
-
175
-
176
-
177
-
178
-
179
-
180
-
181
-
182
-
183
-
184
-
185
-
186
-
187
-
188
-
189
-
190
-
191
-
192
-
193
-
194
-
195
-
196
 |
 |

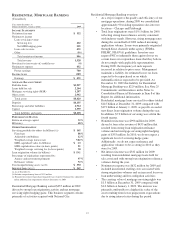
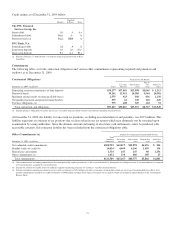
We seek to achieve our credit portfolio objectives by
maintaining a customer base that is diverse in borrower
exposure and industry types. We use loan participations with
third parties, loan sales and syndications, and the purchase of
credit derivatives to reduce risk concentrations. Corporate
Credit personnel also participate in loan underwriting and
approval processes to help ensure that newly approved loans
meet policy and portfolio objectives.
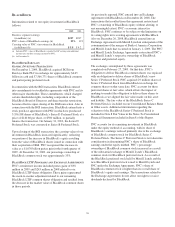
The credit granting businesses maintain direct responsibility
for monitoring credit risk within PNC. The Corporate Credit
Policy area provides independent oversight to the
measurement, monitoring and reporting of our credit risk and
reports to the Chief Risk Officer. Corporate Audit also
provides an independent assessment of the effectiveness of the
credit risk management process. We also manage credit risk in
accordance with regulatory guidance.
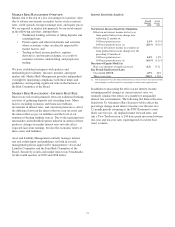
Nonperforming, Past Due And Potential Problem Assets
See the Nonperforming Assets And Related Information table
in the Statistical Information (Unaudited) section of Item 8 of
this Report and included here by reference for details of the
types of nonperforming assets that we held at December 31 of
each of the past five years. In addition, certain performing
assets have interest payments that are past due or have the
potential for future repayment problems.
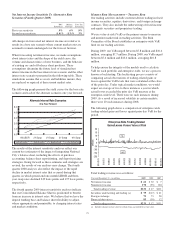
Credit quality deterioration continued during 2009 as
expected, reflecting further economic weakening and resulting
in net additions to loan loss reserves. However, past due loans
appear to be stabilizing and while nonperforming loans
increased in the fourth quarter of 2009, the growth rate was
lower than in prior 2009 quarters.
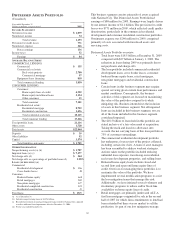
Nonperforming assets increased $4.1 billion to $6.3 billion at
December 31, 2009 compared with $2.2 billion at
December 31, 2008. The increase resulted from recessionary
conditions in the economy and reflected a $2.6 billion increase
in commercial lending nonperforming loans and a $1.4 billion
increase in consumer lending nonperforming loans. The
increase in nonperforming commercial lending was primarily
from real estate, including residential real estate development
and commercial real estate exposure; manufacturing; and
service providers. The increase in nonperforming consumer
lending was mainly due to residential mortgage loans. While
nonperforming assets increased across all applicable business
segments during 2009, the largest increases were $2.0 billion
in Corporate & Institutional Banking and $854 million in
Distressed Assets Portfolio.
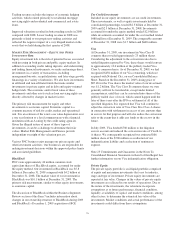
Purchased impaired loans are excluded from nonperforming
loans. Any decrease in expected cash flows of individual
commercial or pooled consumer purchased impaired loans
would result in a charge to the provision for loan losses in the
period in which the change becomes probable. Any increase in
the expected cash flows of purchased impaired loans would
first result in a recovery of previously recorded allowance for
loan losses and then an increase to accretable interest income
for the remaining life of the impaired loans. See Note 6
Purchased Impaired Loans Related to National City in the
Notes To Consolidated Financial Statements in Item 8 for
additional information.
The portion of the allowance for loan and lease losses allocated
to commercial lending nonperforming loans was 29% at
December 31, 2009 and 34% at December 31, 2008.
Approximately 60% of these nonperforming loans are secured
by collateral that is expected to reduce credit losses and require
less reserves in the event of default. Additionally, the allowance
for loan and lease losses was reduced by $112 million during
2009 relating to additional loans deemed to be within the scope
of FASB ASC 310-30 as of December 31, 2008.
Nonperforming assets were 3.99% of total loans and
foreclosed and other assets at December 31, 2009 compared
with 1.24% at December 31, 2008.
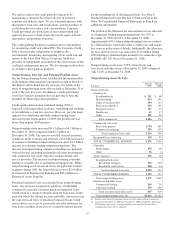
Nonperforming Assets By Type
In millions
Dec. 31
2009
Dec. 31
2008
Nonaccrual loans
Commercial
Retail/wholesale $ 231 $88
Manufacturing 423 141
Other service providers 394 114
Real estate related (a) 419 151
Financial services 117 23
Health care 41 37
Other 181 22
Total commercial 1,806 576
Commercial real estate
Real estate projects 1,754 659
Commercial mortgage 386 107
Total commercial real estate 2,140 766
Equipment lease financing 130 97
TOTAL COMMERCIAL LENDING 4,076 1,439
Consumer
Home equity 356 66
Other 36 4
Total consumer 392 70
Residential real estate
Residential mortgage 955 139
Residential construction 248 14
Total residential real estate 1,203 153
TOTAL CONSUMER LENDING 1,595 223
Total nonperforming loans 5,671 1,662
Foreclosed and other assets
Commercial lending 266 50
Consumer lending 379 469
Total foreclosed and other assets 645 519
Total nonperforming assets (b) $6,316 $2,181
(a) Includes loans related to customers in the real estate and construction industries.
(b) Amounts at December 31, 2009 and December 31, 2008 included $3.8 billion and
$738 million, respectively, of nonperforming assets related to National City,
excluding those loans that we impaired.
67